3
$\begingroup$

Suppose:

\begin{equation} x|\sigma^2 \sim \mathcal{N}(x; \mu, \sigma^2) \; \; st. \; \; \sigma^2 \sim \mathcal{X}^{-2}(\sigma^2; \psi, v) \end{equation}

where $\mathcal{X}^{-2}$ is the inverse chisquared distribution with degrees of with scale parameter $\psi$ and degrees of freedom $v$.

It is known that the marginal distribution of $x$ can be calculated as follos:

\begin{equation} \begin{aligned} p(x) &= \int p(x|\sigma^2)p(\sigma^2)\; d\sigma^2 \\ &= \int \mathcal{N}(x; \mu, \sigma^2)\mathcal{X}^{-2}(\sigma^2; \psi, v) \; d\sigma^2 \\ &= \mathcal{T}(x; \psi, v) \end{aligned} \end{equation}

Where $\mathcal{T}$ is the student $t$-distribution with scale parameter $\psi$ and degrees of freedom $v$. From here, the confidence interval can be calculated directly from the $t$-distribution.

I would like to show that Montecarlo methods can also be used to approxmate the confidence interval of $x$. However, surprisingly the average of confidences does not match.

I am approximating the 97.5% confidence as follows:

  1. Sample 1,000 variances from $\mathcal{X}^{-2}(\sigma^2; \psi, v)$
  2. Compute the 97.5% confidence of a normal using each sampled variance.
  3. Average the resulting confidence.

I am essentially averaging the y-values of the bottom chart.
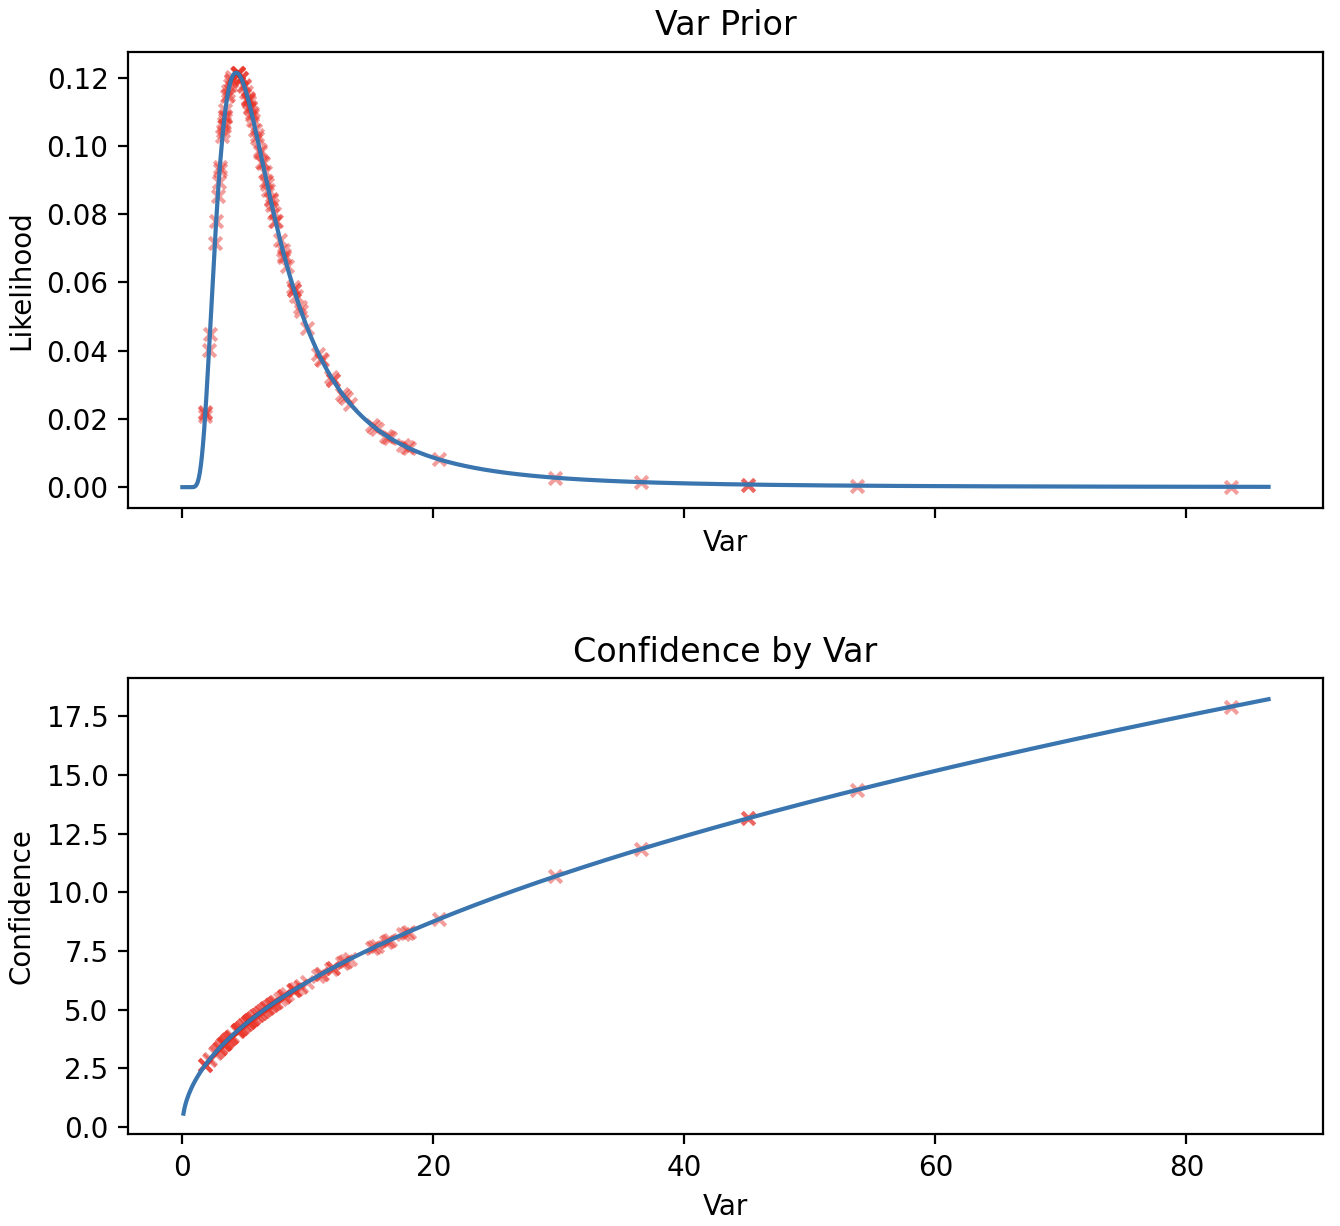
As mentioned the average obtained in step-3 does not match the 97.5% confidence of $\mathcal{T}(x; \psi, v)$.

Are there any suggestions as to how to approximate the 97.5% confidence using sampling methods?

$\endgroup$
3
  • 1
    $\begingroup$ What do you mean by 'confidence interval'? The CI of a sample's parameter estimate depends on its sample size (and not the number of resamples). It seems like you might be calculating the distribution's quantiles? Neither of these are linear functions so I don't think averaging samples together is the way to go. $\endgroup$
    – PBulls
    Commented Jan 29 at 12:33
  • $\begingroup$ @PBulls, I am interested in finding $x_c \;\; st. \;\; \int_{-\infty}^{x_c}$p(x) = 0.975. I am not sampling $x$s then approximating the confidence interval. I am sampling confidence intervals. But inevitably this does not work. $\endgroup$ Commented Jan 29 at 19:36
  • 1
    $\begingroup$ Are you perhaps supposing a quantile of a ratio of two independent random variables must be the ratio of the quantiles of those variables? As @PBulls wrote, that is almost always incorrect. $\endgroup$
    – whuber
    Commented Jan 29 at 21:07

1 Answer 1

3
$\begingroup$

As explained in the comments, you seem to be trying to approximate the 97.5th percentile of these distributions (i.e. the value $c$ so that $\int_{-\infty}^c\text{pdf}(x)=0.975$).

I'm not sure if you have the relationship between the two distributions correct, if $Z\sim \mathcal{N}(0,1)$ and $W\sim \chi^2(\nu)$ are two independent random variables then $Y=\frac{Z}{\sqrt{W/\nu}}$ follows a $t$ distribution with $\nu$ degrees of freedom (see e.g. here).

Approximating the quantile via sampling is then quite straightforward (I'm using R):

p <- .975   ## Desired quantile
df <- 3     ## Degrees of freedom
n <- 1E8    ## Number of MC samples

## Theoretical result
qt(p, df)
> 3.182446

## Sampling approximation
set.seed(1)
quantile(rnorm(n)/sqrt(rchisq(n, df)/df), probs = p)
> 3.182873

Key to remember is that these quantiles are not linear functions, so you cannot get as close an approximation by for example averaging the desired quantile of several batches of smaller sample draws together.

As always, sampling distribution tails becomes progressively less stable the deeper you go - you probably need much more than 1,000 samples.

$\endgroup$
2
  • $\begingroup$ Just to clarify your last line. You sample variance 1e8 times -> from each sampled variance you sample 1e8 times from a normal using the sampled variance/df -> get the quantile of the 1e8 ** 2 points? $\endgroup$ Commented Jan 31 at 0:35
  • $\begingroup$ There are 1E8 independent means and variances in the sample, yes - see also the second paragraph. You can easily verify the precision against the theory, you can get reasonably close using fewer samples. $\endgroup$
    – PBulls
    Commented Jan 31 at 6:51

Your Answer

By clicking “Post Your Answer”, you agree to our terms of service and acknowledge you have read our privacy policy.

Not the answer you're looking for? Browse other questions tagged or ask your own question.