3
$\begingroup$

I am currently working on adjusting p-values in R using the False Discovery Rate (FDR) method and have encountered some confusion regarding the basic concepts of adjusted p-values and q-values. Adjusted p-values result from applying a correction method to control for multiple testing. Indeed in https://genome.ucsc.edu/goldenPath/help/qValue.html, it's stated that: 'The q-value is an analog of the p-value that incorporates multiple testing correction. The q-value is defined as the minimum false discovery rate at which an observed score is deemed significant.' Otherwise, read through a relevant answer https://support.bioconductor.org/p/49864/ , which emphasizes that adjusted p-values and q-values are similar but not quite the same.

I understand the algorithm for calculating q-values, and I understand that repeated values might be encountered. However, I am still seeking clarification on the differences between adjusted p-values and q-values, if any.

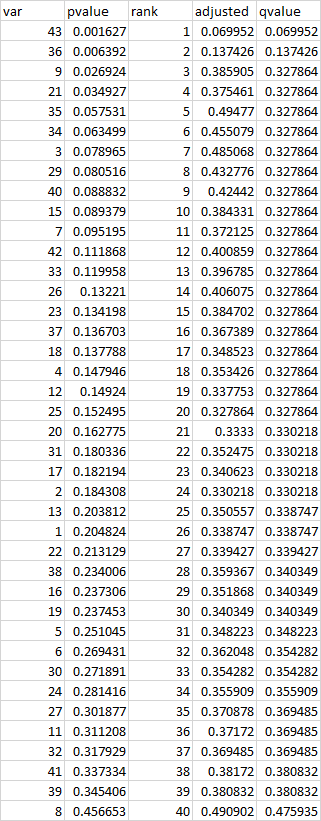
To illustrate my point, I'm using a simple example in R. Imagine that I have the p-values of a two sample t-test with alpha=0.05 conducted on the same individuals for 43 variables:

set.seed(6655)
p_values <- abs(rnorm(43,mean = 0, sd=0.25))
adjusted_p_values <- p.adjust(p_values, method = "fdr")

Showing the results, I get:

enter image description here

Looking at the table, I would say that after the FDR correction I cannot reject the null hypothesis of no differences between the two groups, for each of the variables. Is it this correct? Otherwise, would it be also true that minimum false discovery rate at which that test may be called significant is 0.069 i.e. for variable 43?

EDIT: at this link http://viiia.org/fdrFigs/?scale=1920 it is stated that 'a q-value measures the False Discovery Rate (FDR) you would incur by accepting the given test and every test with a smaller p-value (and maybe even larger p-values, if they improve the FDR).', so that for my data i would say that for the variable 43 the test has a 6.9% chance of being a false positive. But what about for the variables 9 and 21 for example? Is it correct to say that both the tests have a 32.68% chance of being a false positive? I am wondering if this is the only way of interpreting qvalues or there are more straightforward meanings.

$\endgroup$
8
  • $\begingroup$ I can't reproduce your numbers. Can you check them. $\endgroup$ Commented Jan 29 at 16:29
  • $\begingroup$ you're right but i forgot the correct seed. I will edit the question to be as close as possible to the original $\endgroup$
    – Ed9012
    Commented Jan 29 at 16:44
  • $\begingroup$ This still isn't quite right. What you have in your q-value column is the adjusted p-value. What's in your adjusted column is the adjusted p-value before the correction that forces them to be monotonic with p. $\endgroup$ Commented Jan 29 at 17:07
  • $\begingroup$ the adjusted column is something that i calculated by hand. it was just to understand why then i will get repeated q-values $\endgroup$
    – Ed9012
    Commented Jan 29 at 17:18
  • $\begingroup$ I can't help much with your question, but I do think that it is worth considering the utility of FDR and other 'corrections' in gene association studies. Given that surveys of a large number of genes and their associations can properly be thought of as preliminary studies, how do 'corrections' that increase the false negatives help? Any positives should be tested in a designed experiment or, at least, with fresh data and that gives excellent protection against false positives. You can rank the interestingness of the associations on the basis of the raw p-values. How does FDR help? $\endgroup$ Commented Jan 31 at 20:51

1 Answer 1

3
+25
$\begingroup$

I think you are getting confused because you are conflating two separate FDR procedures: 1) the BH FDR method implemented by p.adjust, and 2) the Storey pFDR 'q-value' procedure. In practice, however, the term 'q-value' has come to mean 'FDR-adjusted p-value', rather than specifically the Storey pFDR qvalue. The two methods will, however, yield identical results when the null is true. Wikipedia is a good resource in this case.

I can't reproduce your q-values, since you do not provide code, but note that the distribution you provide is not a valid p-value distribution, as there is no value greater than 0.5, which is an extremely odd outcome after having conducted 43 tests. As a result, I think the q-values you've calculated are not correct (the qvalue package throws an error because it isn't a valid distribution).

Here's a valid example:

if (!require("BiocManager", quietly = TRUE))
  install.packages("BiocManager")

BiocManager::install("qvalue")
library(qvalue)

set.seed(6655)
p.dat  =data.frame(p_values = sapply(c(1:100),function(X){cor.test(rnorm(n = 1000,mean = 0,sd = 1),rnorm(n = 1000,mean = 0,sd = 1))$p.value}))
p.dat$p_fdr_BH = p.adjust(p.dat$p_values, method = "fdr")
p.dat$p_fdr_q = qvalue(p = p.dat$p_values,fdr.level = .05)$qvalues
p.dat = p.dat[order(p.dat$p_values),]

head(p.dat)

     p_values  p_fdr_BH   p_fdr_q
13 0.00677724 0.5436862 0.5436862
42 0.01423080 0.5436862 0.5436862
31 0.02289128 0.5436862 0.5436862
26 0.02373593 0.5436862 0.5436862
90 0.03139673 0.5436862 0.5436862
51 0.03262117 0.5436862 0.5436862

And here's another example where the null is false. We can see that two procedures yield different adjusted p-values.

install.packages('clusterGeneration')
install.packages('mvtnorm')

set.seed(12345)
cov.mat = clusterGeneration::genPositiveDefMat(dim = 101,covMethod = "eigen")
dat = mvtnorm::rmvnorm(n = 1000,mean = rep(0,101),sigma = cov.mat$Sigma)

y = dat[,1]
x = dat[,-1]

p.dat2  =data.frame(p_values =apply(x, 2,function(X){cor.test(y,X)$p.value},simplify = TRUE))
p.dat2$p_fdr_BH = p.adjust(p.dat2$p_values, method = "fdr")
p.dat2$p_fdr_q = qvalue(p = p.dat2$p_values,fdr.level = .05)$qvalues
p.dat2 = p.dat2[order(p.dat2$p_values),]

head(p.dat2)

       p_values     p_fdr_BH      p_fdr_q
83 2.283144e-30 2.283144e-28 1.214469e-28
31 4.430523e-16 2.215261e-14 1.178360e-14
89 2.632440e-08 8.774801e-07 4.667566e-07
13 9.638186e-08 2.409547e-06 1.281706e-06
47 1.840107e-07 3.680213e-06 1.957610e-06
11 5.333084e-07 8.888474e-06 4.728031e-06
$\endgroup$

Your Answer

By clicking “Post Your Answer”, you agree to our terms of service and acknowledge you have read our privacy policy.

Not the answer you're looking for? Browse other questions tagged or ask your own question.