1
$\begingroup$

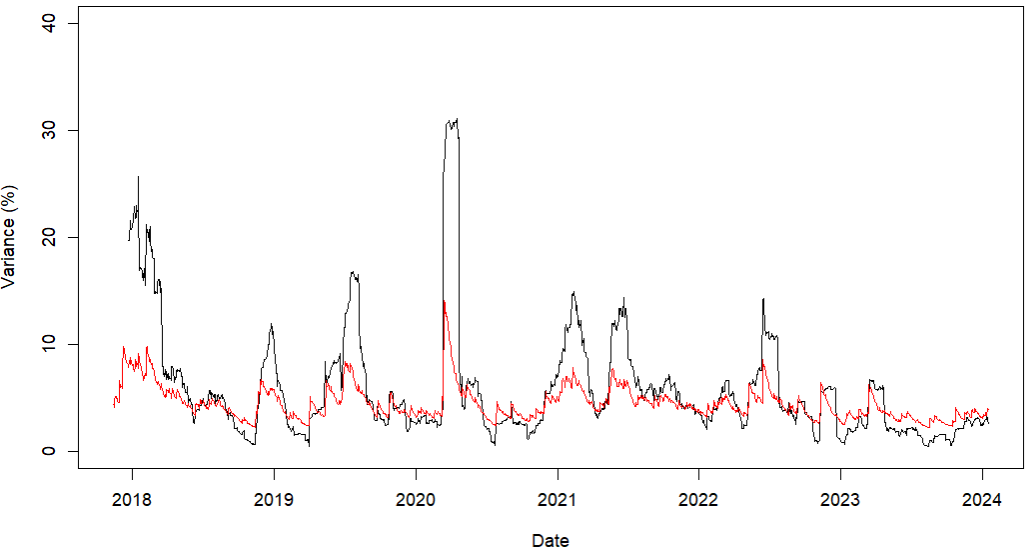
I estimated the variance of Bitcoin in several ways using the var command in R, and within a GARCH model. I get series that look a bit similar, but the y-axis gives different results. Is this normal?

enter image description here

Here, the variance is estimated within a GARCH model (in red) and as the realized variance (in black), i.e the sum of past squared returns (over 30 days).

$\endgroup$
5
  • $\begingroup$ Given the different scales (ranges of $Y$ axis), the two graphs are a little tricky to compare. It would be interesting to see a plot where both series are shown together (in different colors). $\endgroup$ Commented Feb 1 at 17:24
  • $\begingroup$ @RichardHardy I've edited the post ! $\endgroup$ Commented Feb 2 at 12:27
  • $\begingroup$ Did you probably mean sum of past squared returns? But then again, if you used var, this is not the sum of past squared returns, it is the variance of past returns. $\endgroup$ Commented Feb 2 at 12:43
  • $\begingroup$ Yes I've used the sum of past squared ! The var measure is even more different with the GARCH modelized variance ! $\endgroup$ Commented Feb 2 at 13:20
  • $\begingroup$ This does not sound plausible. The sums of squared returns should be about 30 times higher than the variance, because variance is the sum divided by 30-1. So GARCH and variance should be on the same scale, but sums of squared returns should be on a different scale (much higher). Unless you are using different data frequencies for different measures of volatility, that is. $\endgroup$ Commented Feb 2 at 13:52

1 Answer 1

1
$\begingroup$

I think this is normal. A GARCH(1,1) model \begin{aligned} y_t &= \mu_t+\varepsilon_t, \\ \mu_t &= ..., \\ \varepsilon_t &= \sigma_t z_t, \\ \sigma_t^2 &= \omega + \alpha_1 \varepsilon_{t-1}^2 + \beta_1 \sigma_{t-1}^2, \\ z_t &\sim i.i.N(0,1) \end{aligned} often has $\beta_1$ close to $0.9$ (and $\alpha_1$ close to $0.1$) which makes it not so sensitive to what happens locally as in your 30-day rolling variance. Thus, you see more variation in your rolling variance than in GARCH but still about the same overall level of variance in both.

$\endgroup$

Your Answer

By clicking “Post Your Answer”, you agree to our terms of service and acknowledge you have read our privacy policy.

Not the answer you're looking for? Browse other questions tagged or ask your own question.