1
$\begingroup$

TLDR; there are 3 approaches I have come across to longitudinal CFA (not SEM) and I am not sure which one is appropriate for simple dimensionality reduction.

I have come across 3 common flavors of CFA models that model latent variables over time.

Q1: which is most appropriate for the intention of dimensionality reduction (predicted latent variable scores would be used in other non-SEM analyses) while respecting the longitudinal nature of the data. To reduce the likelihood of a "it depends" answer, let me state a few assumptions:

  • time differences between repeated measures may not be consistent in some participants, but generally increment by, say, 1 year across measures.
  • there is dropout (i.e. latter timepoints have more missing data)
  • all observed variables are quantitative, be it discrete or continuous

For ease of depiction, I will showcase a hypothetical scenario involving 2 latent variables across 2 timepoints, with each latent variable having 3 observed variables.

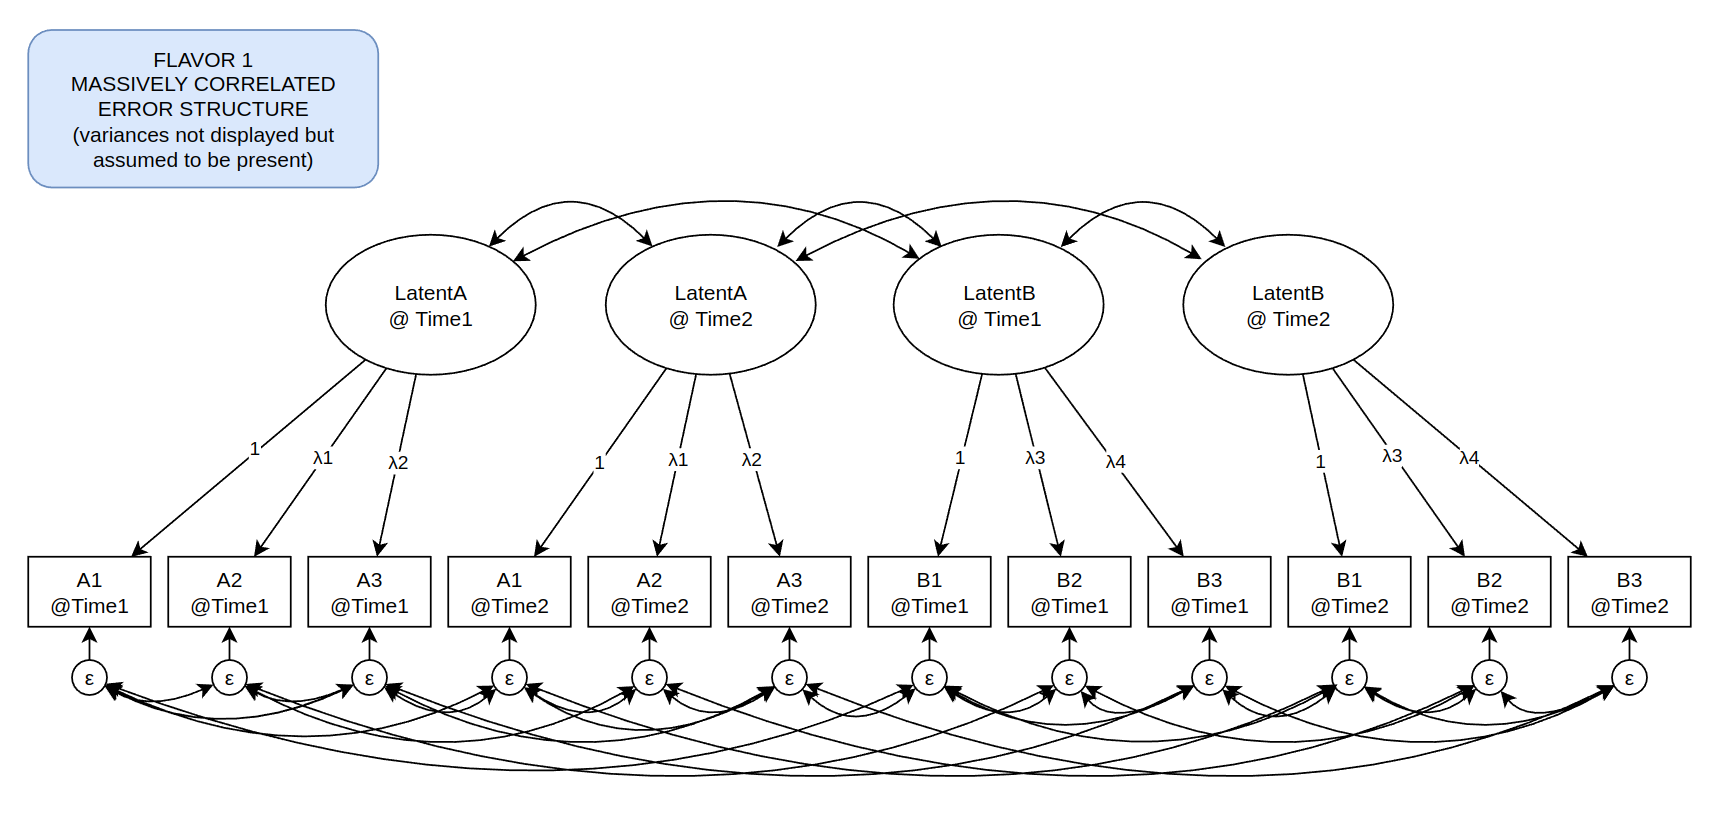
Flavor 1 - Massively-correlated error structure

Example out in the wild.

Flavor 1

To my understanding, this results in massively over-parameterized models and a likely poor fit in terms of indices which penalize over-parameterization. Not scalable over more timepoints for this same reason.

Q2: Given the enormous cost in terms of degrees of freedom, is there ever a reason to use this flavor over the other two?

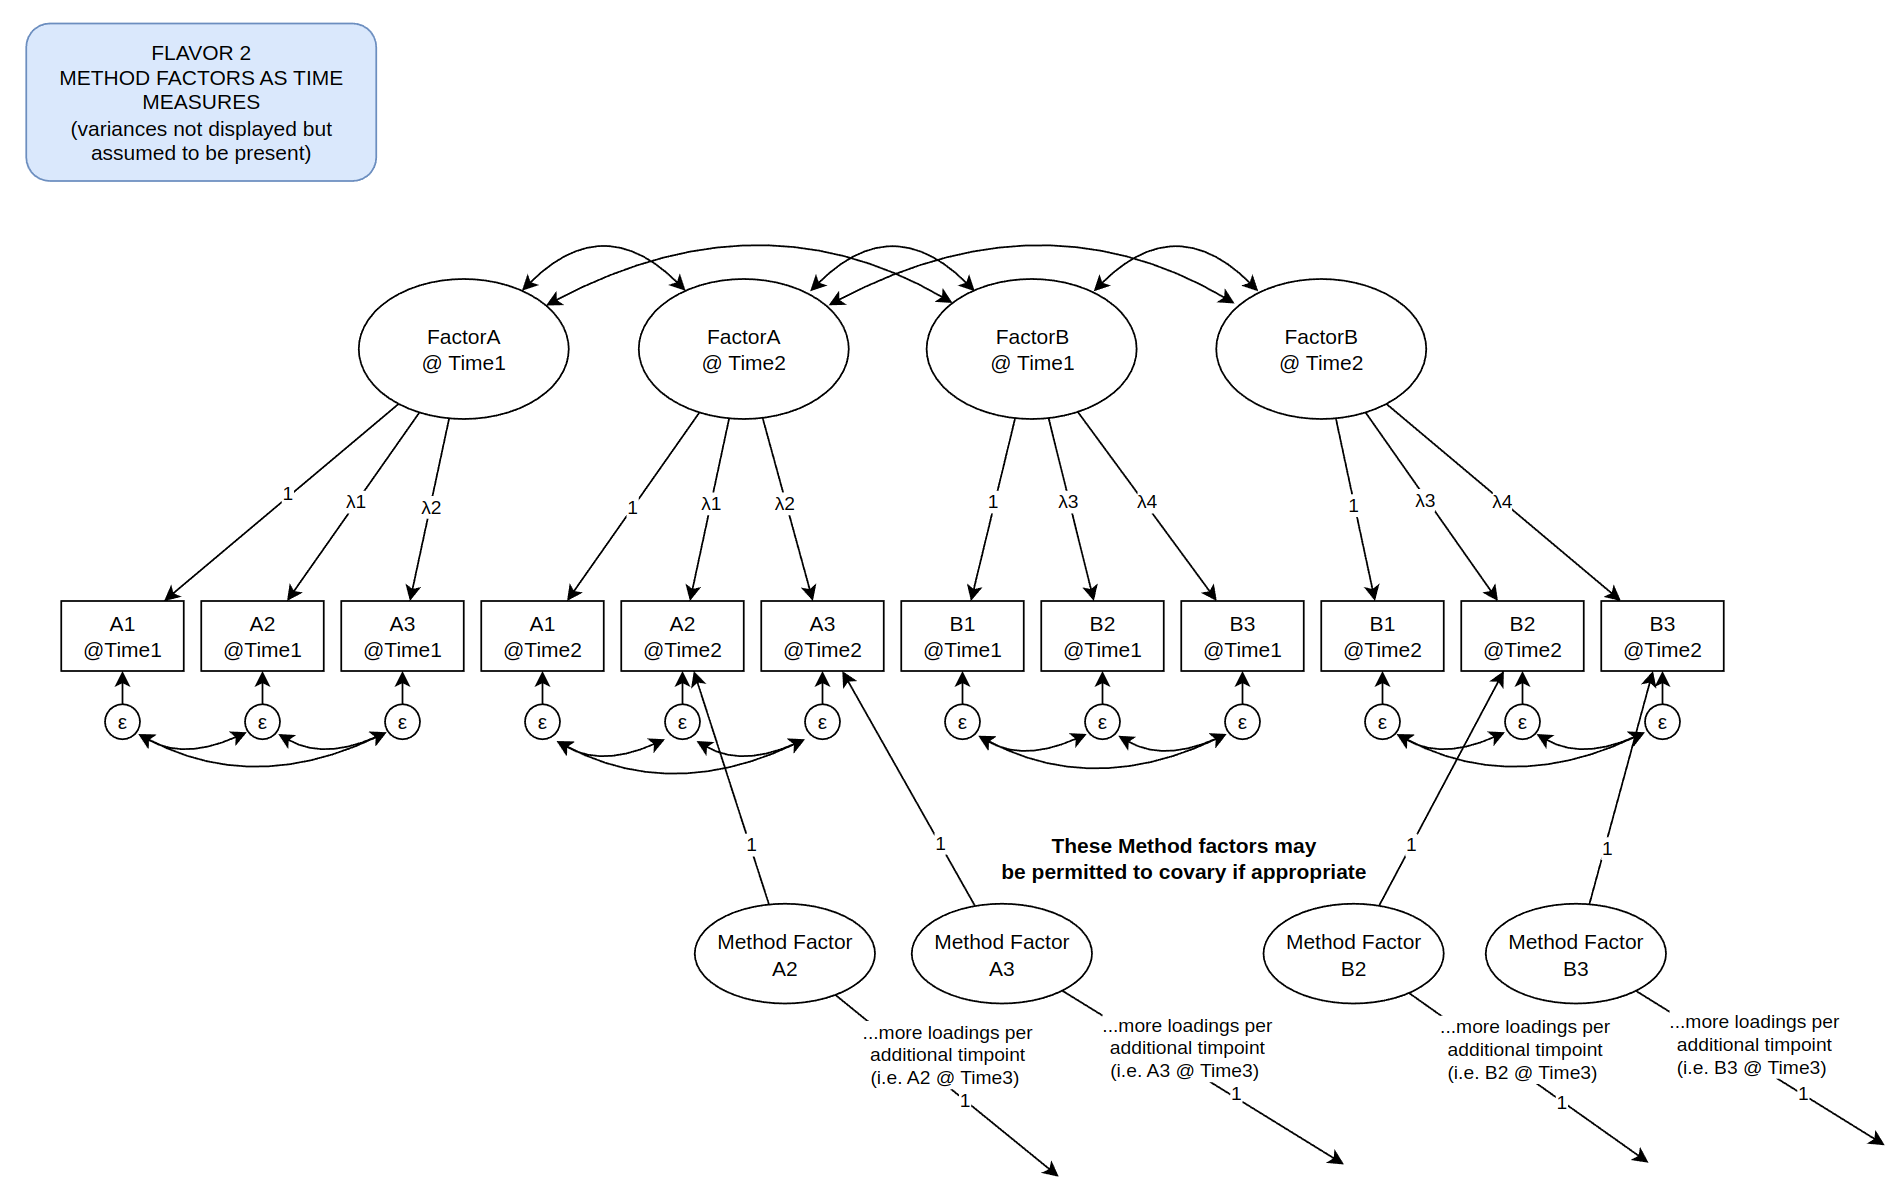
Flavor 2 - Modeling time as Measures (i.e. multi-state multi-trait model)

Example in the wild: Figure 1 in Eid M, Schneider C, Schwenkmezger P. Do you feel better or worse? The validity of perceived deviations of mood states from mood traits. Eur J Pers. 1998;13(4):283-306.

EDIT: Thank you Dr. Geiser for the correction, the example below has been update to reflect it.

Flavor 2

To my understanding, this helps by separating the variance due to repeated measurement.

Q3: Aside from scalar invariance, does using this flavor have any other requirements based on the aforementioned intent?

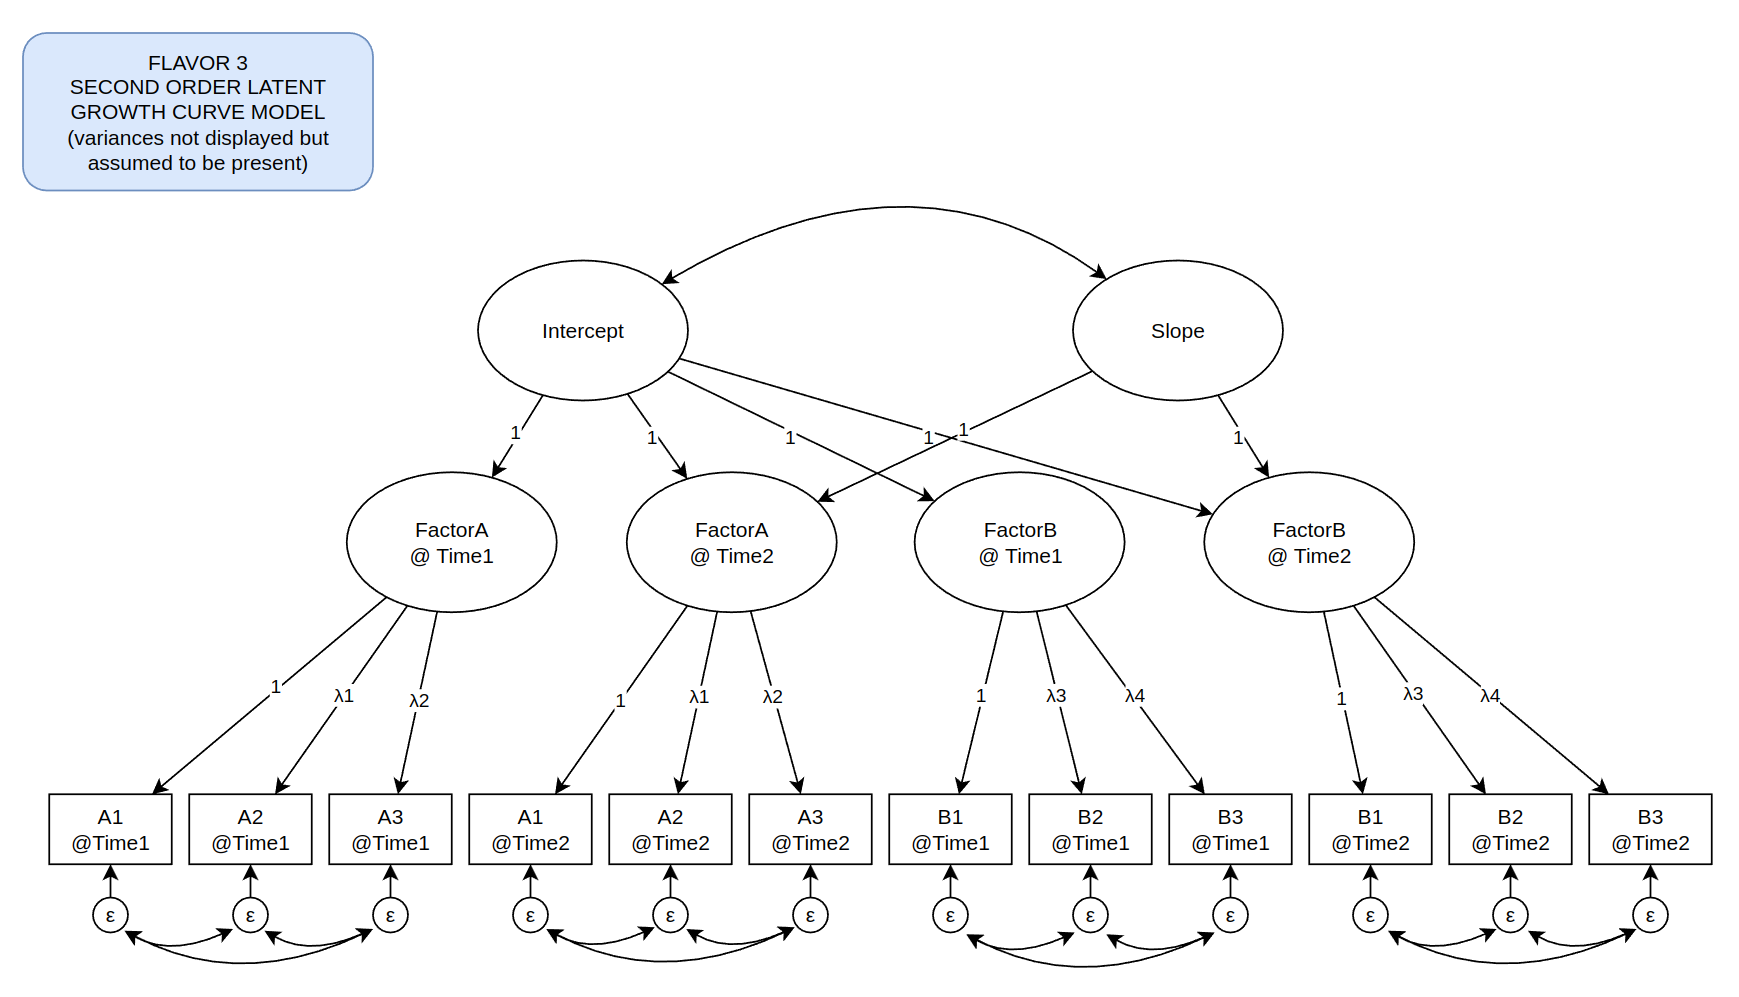
Flavor 3 - Second Order Latent Growth Models

Example out in the wild

Flavor 3

To my understanding, this is an alternative approach to the separation of variance due to repeated measures, akin to what linear mixed effects models do. While the loadings coming off slope depicted above are 1, they can be anything that properly reflects the ratio of average time differences between repeated measures.

Q4: To my understanding, this wouldn't be appropriate for simple dimensionality reduction, as this would specifically require a means structure and if one were to follow-up with, say, linear mixed effects analysis of the latent scores, this would amount to double-dipping, correct?

$\endgroup$

1 Answer 1

4
$\begingroup$

In a correlated errors approach, you would typically only correlate the error variables for the same indicator across time (to account for stable indicator-specific variance), but not all the errors for different indicators at the same time point. (What is shared between different indicators at the same time point should be accounted for by the time-specific common factors.)

Nonetheless, the correlated errors approach has important limitations. As you wrote, it is not parsimonious, especially when there are many indicators and/or many time points. It confounds reliable (indicator-specific) variance with measurement error variance, leading to an underestimation of the indicator reliabilities. It often leads to an overparameterization because not all error covariances are needed (some are typically close to zero and not statistically significant). I discuss this issue in detail in the following Youtube video:

https://www.youtube.com/watch?v=5kv4poKf6Cw

I personally prefer an approach with one method (indicator-specific, IS) factor less than indicators present per construct (Eid, Schneider, & Schwenkmezger, 1999). The IS factor approach is more parsimonious and allows you to separate (shared vs. indicator-specific vs. error) variance components.

Note that the way in which you depicted this approach as "Flavor 2" does not seem correct. There would be four total IS factors in your design with two constructs, two time points, and three indicators per construct. Specifically, there would be one IS factor for A2, one for A3, one for B2, and on for B3, assuming (without loss of generality) that A1 and B1 serve as reference indicators. I described the IS approach as well as its advantages over the correlated errors approach in detail in my book:

Geiser, C. (2021). Longitudinal structural equation modeling with Mplus: A latent state-trait perspective. New York: Guilford Press. (Chapter 4.3)

A mean structure would be included in most longitudinal CFA measurement models as we typically also test for measurement invariance/equivalence across time (which involves intercepts and thus specifying a mean structure) and compare latent means.

A second-order growth model would not make sense for your design with just two time points. Such a model requires at least three measurement occasions. But you could examine a latent change/latent difference score model with multiple indicators. That model is equivalent to a basic longitudinal CFA measurement model (see references below):

References

Eid, M., Schneider, C., & Schwenkmezger, P. (1999). Do you feel better or worse? The validity of perceived deviations of mood states from mood traits. European Journal of Personality, 13, 283–306.

Raykov, T. (1993). A structural equation model for measuring residualized change and discerning patterns of growth or decline. Applied Psychological Measurement, 17, 53-71.

Steyer, R., Eid, M., & Schwenkmezger, P. (1997). Modeling true intraindividual change: True change as a latent variable. Methods of Psychological Research - Online, 2, 21–33.

$\endgroup$

Your Answer

By clicking “Post Your Answer”, you agree to our terms of service and acknowledge you have read our privacy policy.

Not the answer you're looking for? Browse other questions tagged or ask your own question.