1
$\begingroup$

I have some data of with the relationship
Y=commonFactor+error1 and X=Alpha+Beta*commonFactor+error2
I want to test the hypothesis that Beta is non-zero, or that there is a significant relationship between my measured X and Y, or that they share a common factor. I've read that null hypothesis testing isn't possible in cases of MA/SMA/RMA, but I think that shouldn't apply to deming/orthogonal regression right? But i've looked through every single R package on Deming/orthogonal/total least squares regression I can find, and none of them offer a test of the non-zero hypothesis, so I think I have to manually implement it, but I don't understand statistics well enough to come up with the formula to test. any help would be appreciated.
EDIT: it appears a reasonable way to compare the fit of a total least squares model and an OLS model is to compare the likelihoods (by first converting to AIC perhaps). But if they can be compared this way, why? it seems like total least squares is explaining something different, perhaps the joint distribution of X and Y, from the OLS which only calculates the likelihood of just one of the variables?
EDIT 2: In trying to compare OLS and TLS (total least squares) it is useful to have some code to create and analyze data, hence:

# R code to create data and compare OLS to TLS properties/performance.
tcommon<-rnorm(numPoints) # common value
te1<-rnorm(numPoints) # error
te2<-rnorm(numPoints) # error
te3<-rnorm(numPoints) # error
te4<-rnorm(numPoints) # error
# create first dataset "tdata" where X and Y have error
tx<-tcommon+te1+te2; ty<-tcommon+te3+te4
tdata<-list();tdata$X<-tx; tdata$Y<-ty; tdata<-as.data.frame(tdata)
# create second dataset "tdata2" where X has no error and Y has the X error
# subtracted from it.
tdata2<-list();tdata2$X<-tcommon; tdata2$Y<-tcommon+te3+te4-te1-te2; tdata2<-as.data.frame(tdata2)
# convert dataframes to vectors for methods which need that format of data
dtaX1<-tdata$X; dtaX2<-tdata2$X; dtaY1<-tdata$Y; dtaY2<-tdata2$Y
# Analyze data set one with OLS
tlm1XY<-lm(Y~X,data=tdata); tlm1YX<-lm(X~Y,data=tdata)
# Analyze data set one with TLS
# the "tls" function is copy and pasted from https://rdrr.io/bioc/DTA/src/R/wtls.R
dta1<-tls(dtaY1~dtaX1+0)
dta2<-tls(dtaY2~dtaX2+0)
$\endgroup$
9
  • $\begingroup$ You can check whether 0 is in the confidence interval of beta. $\endgroup$ Commented Mar 14 at 9:30
  • 1
    $\begingroup$ okay thanks. i have one followup which i'm going to edit the original question to include. how can i compare the fit provided by a Deming regression to that by an OLS. The answer is probably compare the loglik of the best OLS regression (X~Y or Y~X) to the loglik of the total least squares fit. but why are they comparable, it seems like the OLS only considers the loglik of Y|X whereas shouldn't total least squares give the loglik of the joint distribution (X,Y)? $\endgroup$ Commented Mar 14 at 10:15
  • $\begingroup$ @AFriendlyFish Do you mean to ask something like, “How do I know if the OLS does a batter job of doing what it does than Deming regression does at what it does?” $\endgroup$
    – Dave
    Commented Mar 14 at 14:44
  • $\begingroup$ actually my question is even simpler, are they equivalent? I know the estimated slope will be different, but will the actual significance of a purported relationship be the same? I know regressing Y on X and X on Y which minimize the vertical and horizontal distances yield the same p-value, but what if you minimize both simultaneously (i.e. their sum)? Then it should still give the same p-value right? but the assumptions of two errors instead of one make it seem like these models definitely have to be different and not equivalent. thank you! $\endgroup$ Commented Mar 14 at 19:28
  • 1
    $\begingroup$ So compare to the OLS test of $H_0: \beta = 1$. $\endgroup$
    – Dave
    Commented Mar 14 at 19:49

1 Answer 1

1
$\begingroup$

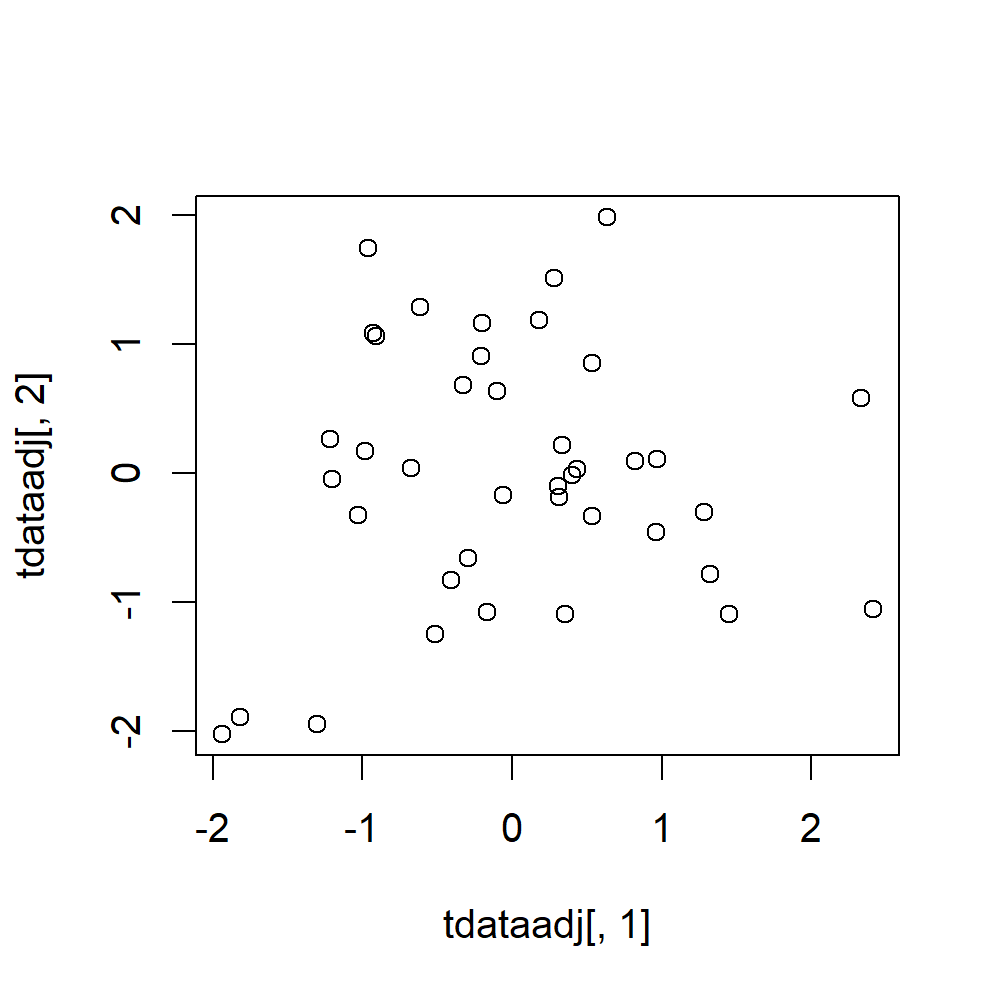
I wasn't able to find any R packages that gives a p-value for the hypothesis that relationship is non-zero, but! as Dave said in the comments, you can look at the confidence intervals and see if they contain zero. I generated this dataset using the code in the question. The full set of points is given at the bottom of this answer. enter image description here Basically I first generated the common random variable, then I added two different noises and labeled the sums X and Y and then standardized the variables so they have mean 0 and sd 1, and then I did this analysis:

> dem1adj = SimplyAgree::dem_reg(x = "X",
                               y = "Y",
                               data = tdataadj,
                               error.ratio = 1,
                               weighted = FALSE)
> dem1adj
Deming Regression with 95% C.I.
               coef    bias     se df lower.ci upper.ci         t p.value
Intercept 1.648e-17  0.3306 0.3043 38  -0.6159   0.6159 5.416e-17       1
Slope     1.000e+00 -2.2064 3.3213 38  -5.7237   7.7237 0.000e+00       1

You can see that it does recover the true slope perfectly, which is good, but the confidence interval is ridiculously wide. Comparing this to OLS regression results we see that it measures a different slope with much smaller confidence intervals:

> tlm1XYadj<-lm(Y~X,data=tdataadj)
> summary(tlm1XYadj)
Call:
lm(formula = Y ~ X, data = tdataadj)

Residuals:
     Min       1Q   Median       3Q      Max 
-1.86093 -0.67556  0.01114  0.73277  1.93398 

Coefficients:
             Estimate Std. Error t value Pr(>|t|)
(Intercept) 5.957e-18  1.596e-01   0.000    1.000
X           8.483e-02  1.616e-01   0.525    0.603

Residual standard error: 1.009 on 38 degrees of freedom
Multiple R-squared:  0.007196,  Adjusted R-squared:  -0.01893 
F-statistic: 0.2754 on 1 and 38 DF,  p-value: 0.6028
> confint(tlm1XYadj)
                 2.5 %    97.5 %
(Intercept) -0.3231002 0.3231002
X           -0.2423850 0.4120476

Finally, using the framework provided here: https://stackoverflow.com/questions/20916460/change-null-hypothesis-in-lmtest-in-r I did test the hypothesis Beta1!=1 for the results from the lm regression. The slope of 1 was significantly rejected (remember I generated the data with a slope of 1 by having the same variable appear in both X and Y unmodified and then adding different error to both sides). And here's the data I used:

> tdataadj
             X           Y
1  -1.03162320 -0.32693143
2  -0.32622233  0.67991939
3   0.43389383  0.03415296
4   0.18279931  1.19163987
5  -0.05768708 -0.16677914
6  -0.93105396  1.08877898
7   0.96882546  0.11012679
8   0.53361944 -0.33525390
9   0.30807441 -0.09631317
10  0.31379470 -0.18302437
11  0.63422554  1.98778358
12  0.40106748 -0.01707597
13  0.33668007  0.21529383
14 -1.81610356 -1.89267178
15  2.33086692  0.58376939
16  1.32242220 -0.78551085
17 -1.21510257  0.26737799
18 -0.61251655  1.28683480
19 -0.09945225  0.63374035
20 -0.20994760  0.91045981
21  1.44842973 -1.09361737
22  0.27848282  1.51481991
23 -0.29062107 -0.66156765
24 -1.30265042 -1.94811983
25 -0.67633301  0.04255624
26  0.95956466 -0.45731566
27 -0.96100702  1.74357670
28  0.35176547 -1.08995059
29 -0.16483944 -1.07744841
30  2.40902229 -1.05429291
31  0.53104092  0.85336423
32 -0.97953605  0.17160045
33  1.28377097 -0.30414070
34 -1.20202696 -0.04712242
35 -1.93474927 -2.02505640
36 -0.51648326 -1.25078289
37 -0.90818395  1.06284063
38 -0.40711632 -0.82603933
39  0.81821206  0.09435079
40 -0.20330241  1.16602810
$\endgroup$

Your Answer

By clicking “Post Your Answer”, you agree to our terms of service and acknowledge you have read our privacy policy.

Not the answer you're looking for? Browse other questions tagged or ask your own question.