3
$\begingroup$

I would like to generate a synthetic dataset where there are multiple records per ID, and self-consistency is maintained among records of each ID.

For example, imagine a dataset where the ID is a grocery store, and each record is the sales of various items for that store in a given day. In other words, multiple time series. You can imagine that while there are global trends across all stores, there are also store-level trends, and a realistic dataset must preserve not just global trends, but also store-level trends. Perhaps store A sells more chips on weekends, while store B sells less chips on weekends but more cookies.

A synthetic data model which samples fake records IID would only preserve the global trend of sales ("chips generally sell more than cookies on Fridays"). A model which is another step up in complexity, such as an LSTM, may preserve temporal trends which express across all stores ("if cookies sold less than chips at time t-1, they will sell generally more at time t"). But how would I make a model that also allows these trends to vary per-store ("chips generally outsell cookies on Saturdays at certain stores, but the opposite is true at other stores")?

One idea I had is to use domain-knowledge / clustering to assign stores to one of N "profiles," then use that profile as a feature. The model would naturally be able to capture the dependency. That said, this approach requires manual definition of N and creates a finite set of profiles. I am looking for something less limiting and which can detect more subtle profiles than I may be able to manually, if it exists.

Hopefully I've explained my problem well enough - feel free to ask for clarification. Links to relevant papers would be greatly appreciated. Thank you!

$\endgroup$

1 Answer 1

1
$\begingroup$

The simplest hierarchical data generating process could use a parameter $p_i$ for the $i$-th product and another parameter $s_j$ for the $j$-th store. Then you could generate data with mean $p_i+s_j$ to stand for sales of product $i$ in store $j$.

You can then expand on this in various ways.

  • You could use a day of week pattern $w_{tj}$ that depends on the day of week of date $t$ (so $w_{tj}=w_{t+7,j}$) and on the store $j$, then add this to the mean: $p_i+s_j+w_{tj}$. You now have a weekly pattern that is common to all products in a store, but will differ between stores.
  • Or, as for overall means, you could mix day of week patterns per store as above with another set of patterns per product, $v_{ti}$ for the $i$-th product, for a mean of $p_i+s_j+w_{tj}+v_{ti}$.
  • Products are typically related hierarchically, with sales of different SKUs of milk being more closely related to each other than to sales of canned soup and diapers. You could model this by including terms that are set on various hierarchical levels.
  • You could add some yearly seasonality, e.g., by including harmonics. These could again be common per store, or per product, or per product hierarchy level.
  • Nothing says your terms have to be added. Multiply them together if you want.
  • Sales are typically integer, so I would recommend using some count data distribution. I personally like the negative binomial.
  • Especially if you use the negbin, it's natural to use a log link, by having each day's mean sales be $\exp f_{tij}$, however you calculated the log-mean $f_{tij}$ per day, product and store.

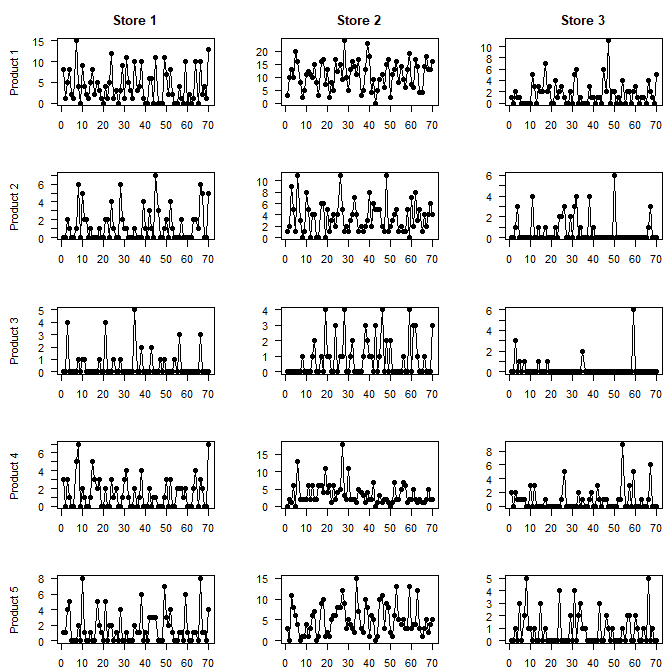
Here are some sales with $\mu_{tij}=\exp(p_i+s_j+w_{tj})$, i.e., we have a store-level day of week pattern:

simulated sales

Retail sales are typically characterized by overdispersion (Fildes et al., 2022, IJF - ping me on ResearchGate if you don't have access), which I included in the simulation above by generating data using a negative binomial distribution. If you want equidispersed data, you could use a Poisson distribution, which is simpler (but in my opinion less realistic).

More generally, one could use a GAMLSS (Generalized Additive Model for Location, Shape and Scale), where a relationship like the one above is used not only to parameterize the mean or location as in the example above, but also other parameters of a suitable distribution, like the shape or scale. Such methods generalize the simple negbin assumption used above. A good place to start is Ziel (2022, IJF) (open arXiv version here), who used GAMLSS methods to forecast retail sales, specifically the Walmart sales in the M5 forecasting competition.

R code for the picture above:

n_stores <- 3
n_products <- 5
n_weeks <- 10
nb_overdispersion <- 2  # >1

set.seed(1)
store_levels <- rnorm(n_stores)
product_levels <- rnorm(n_products)
weekday_patterns <- replicate(n_stores,rnorm(7))

sales <- list()
for ( ss in 1:n_stores ) {
    sales[[ss]] <- list()
    for ( pp in 1:n_products ) {
        mu <- exp(store_levels[[ss]]+product_levels[[pp]]+rep(weekday_patterns[,ss],n_weeks))
        size <- mu/(nb_overdispersion-1)
        sales[[ss]][[pp]] <- rnbinom(7*n_weeks,mu=mu,size=size)
    }
}

opar <- par(mfcol=c(n_products,n_stores),las=1,mai=c(.3,.6,.4,.1))
    for ( ss in 1:n_stores ) {
        for ( pp in 1:n_products ) {
            plot(sales[[ss]][[pp]],type="o",pch=19,xlab="",
                ylab=ifelse(ss==1,paste("Product",pp),""),
                main=ifelse(pp==1,paste("Store",ss),""))
        }
    }
par(opar)
$\endgroup$
6
  • $\begingroup$ This models the granular features nicely — but every feature of the model will add to the variance of the total sales. So those totals are likely to end up with implausibly large variances which constrain the model’s utility. $\endgroup$
    – user225256
    Commented Apr 10 at 8:38
  • $\begingroup$ @MattF.: I would disagree. Retail sales are almost invariably overdispersed (exceptions are very fast movers that are not shelf stable, like milk, or products with constrained supply). If the OP prefers an equidispersed Poisson distribution, they can certainly use that. (And I would argue that I would be more concerned about equidispersion limiting this simulation's utility.) Alternatively, and again IMO more validly, one can go full GAMLSS. $\endgroup$ Commented Apr 10 at 12:35
  • $\begingroup$ Can you say more about how to use the GAMLSS approach in this case where one does not have good data for fitting, but wants to create data with some expected features? $\endgroup$
    – user225256
    Commented Apr 12 at 1:05
  • 1
    $\begingroup$ @MattF.: Ziel (2022, IJF) used GAMLSS to forecast retail sales, the Walmart data in the M5 competition. That would be a very good place to start. $\endgroup$ Commented Apr 12 at 11:40
  • $\begingroup$ I would upvote if a paragraph on Ziel’s GAMLSS is added to your answer…maybe giving the Arxiv link arxiv.org/abs/2107.06675 and maybe mentioning that Ziel’s first footnote found your 2016 paper a good place to start! $\endgroup$
    – user225256
    Commented Apr 12 at 17:18

Your Answer

By clicking “Post Your Answer”, you agree to our terms of service and acknowledge you have read our privacy policy.

Not the answer you're looking for? Browse other questions tagged or ask your own question.