2
$\begingroup$
Context

Let's say we are talking about a machine learning model that governs some user interaction (e.g. pricing model, recommendation model etc.) on an app. Let's say model v1 is champion (in production) and I developed v2 (as challenger). We also have a metric (completed transactions) to judge whether the models are achieving the business objective.

Because of some architectural constraint, we cannot conduct a true A/B testing, e.g. surfacing v1 and v2 to users totally randomly. But we can

  • Deploy v2 to one region of coverage, let's call it the test region
  • Observe the outcomes of different regions, especially regions statistically similar to the test region (control regions).

Now, day to day variations (beginning/end of the month, weekday, weekend etc. influence consumer behaviour as well), and, secular trends. But in general, similar weekdays show similar patterns. Also assume the model v2 went live on the test region at 12.20 am, 8th April.

Benchmarking

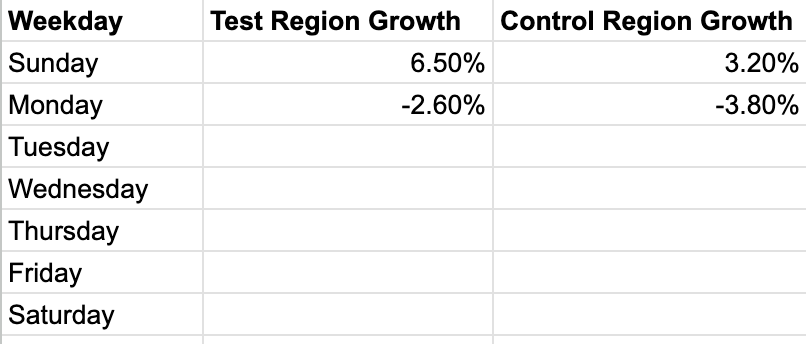
The way I presented the outcome of the model to senior management is like this (numbers are examples)

enter image description here

So basically I compare number of transactions on the Sunday before deployment, after deployment, for test region, control region and see how much we grew Sunday->Sunday in the test region vs the control region. We are comparing the seven days post deployment against seven days pre deployment, and every day, the metric (transactions) either grew more in the test regions, or fell less. Each region is slightly different, so number of absolute transactions is not a fair comparison. That's why we are comparing growth in transaction.

Question 1

Is this a fair way to judge the effectiveness of v2 (test region) against v1 (control region)? I cannot compare against average of all previous wednesdays pre-deployment vs the wednesday post-deployment, because of secular trends. That's why I am using the control region.

Challenge

Now, the senior manager seems to have raised the bar in comparing. He thinks, the model v2 (still confined within the test region), should keep giving. This is what I mean.

So far in the benchmarking exercise, I considered

  • 1-7th April as pre-deployment week
  • 8-14th April as post-deployment week

compared Wednesday (example) against Wednesday (example).

But, he says, even going forward, the test region should continue to outperform the control region on same weekday to weekday. That means, 15 April (Monday) to 22 April growth in test region should be better than the control region.

My question is it a fair expectation? I am not talking about the HIPPO, but purely statistically? My thought process says on 15th, the test region was already enjoying the benefit of v2, so on 22nd, v2 cannot bring an extra benefit to give a bigger percentage lift compared to what v1 brings at control region.

To be noted, the goal of v2 is to do better than v1, its goal is not to keep giving a sustained week-on-week 3.6% lift (or some other number). So can we expect test region growth will continue to outperform control region, when in the test region, v2 will be fighting against itself?

I know it's a long question and I am more of a coder and developer guy than statistician. Feel free to ask me if I am missing any crucial detail to give an objective answer, or my thought process has a gap.

$\endgroup$
2
  • $\begingroup$ What is a HIPPO? $\endgroup$ Commented Apr 22 at 11:14
  • $\begingroup$ Highest paid person's opinion. I mean a play on the corporate trope that whatever the senior management says, must be the uncontested truth, irrespective of ground reality. What I was trying to say is if my thought process is correct on the scenario, irrespective of the director's opinion here. $\endgroup$
    – Della
    Commented Apr 22 at 11:16

1 Answer 1

3
$\begingroup$

Your director can certainly require that your proposed new method gives a week-over-week lift. I agree that this will be harder to achieve than a single bump right after introduction. (Essentially, it's a question of having a break in trend rather than a break in level only.) It's a higher bar.

You have two separate questions.

  1. Is this realistic? Is it feasible?
  2. Is this useful?

Point 1, per above, is just a harder bar to clear. It may be possible, or not.

Point 2 boils down to whether a one-time bump of magnitude X is enough to justify rolling your candidate out into production, which may entail quite some costs and investments, or whether it's not, but a change in trend of magnitude Y would be enough. This in the end is not a statistical question, but an economic or business one.

A good way to investigate point 2 would be to try to put actual numbers on your transaction numbers. Make some reasonable assumptions if necessary and present the likely impact on the top or bottom line to management, along with an estimate of the one-shot or ongoing costs of switching to your alternative.

$\endgroup$
7
  • $\begingroup$ Thanks for the answer. It is not about what requirement or KPI the director can impose on me. Of course, that can be as challenging as he wants to make it. But, my question is whether continued outperformance is a fair criterion to establish the superiority of V2 over v1? Assume that deployment costs infrastructure cost etc. are same, and only thing we care about is the transaction metric. $\endgroup$
    – Della
    Commented Apr 22 at 13:56
  • $\begingroup$ Can you elaborate a bit on the difference between breaks in trend Vs level? Is this a well established concept in statistics? $\endgroup$
    – Della
    Commented Apr 22 at 13:58
  • $\begingroup$ "Fairness" is a slippery concept, and I am arguing that it is probably not useful in this situation. You are evaluating a business decision. It is important to make the economically sensible decision, and for that, the bar your director is setting may be appropriate, or too high. The best way IMO is not to get hung up on statistical KPIs, but to consider cold, hard cash, because that is what business ultimately cares about. $\endgroup$ Commented Apr 22 at 14:48
  • $\begingroup$ On changes in level vs. trend: there is a concept of "structural breaks" in time series. The most common one is a change in level, a step change, as when a time series fluctuates around 1 before the break and around 3 after the break. But equally, we could have a change in the trend: the series might be growing at 1 per unit time before the break, but at 1.5 per unit time after the break. Or both breaks might occur at the same time. Your data points to a change in the level. Your director seems to want a change in trend (and level). $\endgroup$ Commented Apr 22 at 14:51
  • $\begingroup$ Cold, hard cash is already accounted for, as the metric we are talking about is revenue from the test and control regions. But your last comment clarifies things a bit. Coming back to the my context, v2 gave a level break of revenue in the test zone, while v1 continued as usual. To me, that seems sufficient to conclude v2 as the winner. If it could give a trend break (yet to crunch the data), that would of course be a bonus, but to me it does not seem necessary to declare it a winner over v1. $\endgroup$
    – Della
    Commented Apr 23 at 1:07

Your Answer

By clicking “Post Your Answer”, you agree to our terms of service and acknowledge you have read our privacy policy.

Not the answer you're looking for? Browse other questions tagged or ask your own question.