1
$\begingroup$

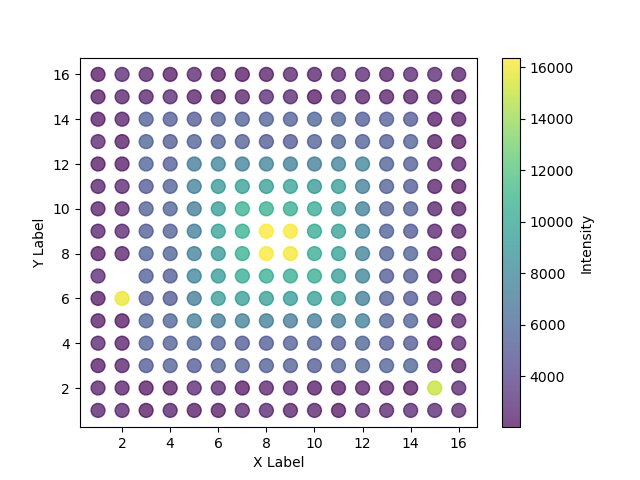
I wonder what kind of method better to use to see outliers on z value of 2D plot. For example, I have measurements of x and y values both in range of 1 to 16 with step of 1. Next I calculate how many observations each pair of x and y (x_n, y_n) have. That give me a grid of 16 by 16 with number of observations per pair (z). Because x and y are correlated we expect to see some pattern - some group of dots more often presented then others. Sometimes in areas where few observations expected, many can be presented. This due to equipment error. Sensor erroneously stamp some value again and again and again. What is the best method to find those errors in large data? If the grid is not 16 by 16 but 9000 x 9000. Also it is possible to use raw data - repeated x and y observations (in case of KDE).

Here is some hard-coded sandbox example:

import pandas as pd
import random
import matplotlib.pyplot as plt
# Let's make data x, y, z.
# x and y are coordinates similar to matrix coordinate
x = [i for i in range(1, 17) for j in range(16)]
y = list(range(1, 17)) * 16


# z is a set of random integer values in some range
def r_num(base_value: int, n_numbers: int):
    return [random.randint(base_value, base_value + 700) for i in range(n_numbers)]

def z_make():
    _z = ((r_num(2000, 16)) +
         (r_num(2000, 16)) +
         (r_num(2000, 2) + r_num(5000, 12) + r_num(2000, 2)) +
         (r_num(2000, 2) + r_num(5000, 12) + r_num(2000, 2)) +
         (r_num(2000, 2) + r_num(5000, 2) + r_num(7000, 8) + r_num(5000, 2) + r_num(2000, 2)) +
         (r_num(2000, 2) + r_num(5000, 2) + r_num(7000, 1) + r_num(9000, 6) + r_num(7000, 1) + r_num(5000, 2) + r_num(2000, 2)) +
         (r_num(2000, 2) + r_num(5000, 2) + r_num(7000, 1) + r_num(9000, 1) + r_num(10000, 4) + r_num(9000, 1) + r_num(7000, 1) + r_num(5000, 2) + r_num(2000, 2)) +
         (r_num(2000, 2) + r_num(5000, 2) + r_num(7000, 1) + r_num(9000, 1) + r_num(10000, 1) + r_num(16000, 2) + r_num(10000, 1) + r_num(9000, 1) + r_num(7000, 1) + r_num(5000, 2) + r_num(2000, 2)))
    return _z


z1 = z_make()
z2 = z_make()
z2.reverse()
z = z1 + z2

for i in ['x','y','z']:
    print('Len of i:', len(eval(i)))

df = pd.DataFrame({'x': x, 'y': y, 'z': z})

# Set some outliers and missing value near outlier
df.loc[(df['x'] == 2) & (df['y'] == 6), 'z'] = 15875
df.loc[(df['x'] == 15) & (df['y'] == 2), 'z'] = 14999
df.loc[(df['x'] == 2) & (df['y'] == 7), 'z'] = None

plt.scatter(df.x, df.y, c=df.z, cmap='viridis', s=100, alpha=0.7)

# Add color bar
plt.colorbar(label='Intensity')

# Set labels and title
plt.xlabel('X Label')
plt.ylabel('Y Label')
plt.show()

enter image description here

So i am looking for two yellow dots on the side of the plot. Neighboring dots has value of z lower then the outliers. In one case neighbor even missing.

I have been studying KDE, contour, and Local Outlier Factor (LOF), but no success. Also i asked alike question in Stack but i wonder if CV community can propose better solution.

Actually KDE worked ok-ish, but bandwidth influence detection of the outliers dramatically. I need to find points (coordinates) where the z value is different from its neighbors’ z values in large scatter-plot.

$\endgroup$
6
  • $\begingroup$ Maybe I am missing something, but if I had 9000 possible values of x and y, I would treat them as continuous and the notion of a "grid" of discrete numbers wouldn't be relevant. $\endgroup$
    – Peter Flom
    Commented May 14 at 10:50
  • $\begingroup$ If all values 1 to 16 are possible and observed for both variables, then anomalies can exist, but I wouldn't call them outliers. Perhaps the relevant criterion is whether any bin has many more values than its neighbours. $\endgroup$
    – Nick Cox
    Commented May 14 at 13:45
  • $\begingroup$ @PeterFlom well, yes may be 9000 too much, but does matter ? $\endgroup$
    – Zoomman
    Commented May 14 at 14:02
  • $\begingroup$ @NickCox, right. Anomaly - outlier. I will correct title $\endgroup$
    – Zoomman
    Commented May 14 at 14:03
  • $\begingroup$ A standard, robust method is to compare each value to a local estimate of distribution (known as "focal statistics" by many who work with gridded data). You need to make some judgments concerning what size moving window to use. With large grids (9000 is by no means large!) you would focus on statistics that can be computed efficiently (which usually involves the FT and would emphasize means and SDs); but with your grid, consider using a spread of local quantiles. For more on this see gis.stackexchange.com/a/14618/664. More generally, examine residuals relative to a robust smooth. $\endgroup$
    – whuber
    Commented May 14 at 14:15

1 Answer 1

0
$\begingroup$

Enhancing my SO answer (which resorts to spatial weight matrices), we could turn your problematic into testing the "Isn't an outlier" null hypothesis. As follows

# Let's get further and compute the probability of each score (k.a. `s`) to
# be a pure luck outlier.
import scipy.stats as st
p_s_k = df['P(|s|>.)'] = 1 - st.norm.cdf(np.abs(dz_k_nz))
alpha = 1e-2
df['Potential pure luck outlier'] = p_s_k > alpha
>>> df.iloc[[19, 21, 22, 23, 224, 225, 226], :]
      x  y        z  ...         s      P(|s|>.)  Potential pure luck outlier
19    2  4   2051.0  ...  0.917377  1.794725e-01                         True
21    2  6  15875.0  ... -8.144082  2.220446e-16                        False  # <---
22    2  7      NaN  ...  0.375904  3.534940e-01                         True
23    2  8   2239.0  ...  1.092621  1.372802e-01                         True
224  15  1   2567.0  ...  1.594606  5.540017e-02                         True
225  15  2  14999.0  ... -8.363313  0.000000e+00                        False  # <---
226  15  3   2662.0  ...  1.463070  7.172409e-02                         True

In this instance, (spatially dissimilar) zs can (very) hardly be considered to be outlying by pure chance.

$\endgroup$
4
  • $\begingroup$ Good! Thanks. Interesting $\endgroup$
    – Zoomman
    Commented May 14 at 14:06
  • 1
    $\begingroup$ The idea is good; but the implementation is inferior to robust local smoothing methods because (1) two or more nearby outlying values are much less likely to be detected and (2) using a normal score will tend to identify too many values as "outlying," thereby requiring further post-processing. $\endgroup$
    – whuber
    Commented May 14 at 14:17
  • 1
    $\begingroup$ I was hoping for such an advice/review. Thanks @whuber. Will have a look at robust local smoothing methods. $\endgroup$
    – keepAlive
    Commented May 14 at 14:19
  • 1
    $\begingroup$ In addition to focal methods, I would look to Loess for small to medium grids and GAMs otherwise. $\endgroup$
    – whuber
    Commented May 14 at 14:31

Your Answer

By clicking “Post Your Answer”, you agree to our terms of service and acknowledge you have read our privacy policy.

Not the answer you're looking for? Browse other questions tagged or ask your own question.