Conditional inference regression trees implemented in the partykit R-library use the following statistic for determining if a split will be carried out or not:
$$ T_j(L_n, w) = vec(\sum w_i g_j(X_{ji}) h(Y_i, (Y_1,...,Y_n)^T))$$
(See Variable selection and stopping criteria in ctree.pdf)
According to https://stats.stackexchange.com/a/342356/161138 this independence test can be replicated with the coin library which works for me. It can be further broken down into its parts as follows:
library(coin)
it <- independence_test(Petal.Length ~ Sepal.Length,
  data = iris, teststat = "quadratic")

(statistic(it, "linear") - expectation(it)) %*%
   solve(covariance(it)) %*%
   t(statistic(it, "linear") - expectation(it))
I have simplified the example to just one independent variable Petal.Length ~ Sepal.Length, there are two in the original question Petal.Length + Petal.Width ~ Sepal.Length.
Now, I am trying to reproduce all the steps in my simplified case:
statistic(it, "linear")is identical tosum(iris$Petal.Length * iris$Sepal.Length)expectation(it)is identical tosum(iris$Petal.Length) * sum(iris$Sepal.Length) / length(iris$Petal.Length)
What is
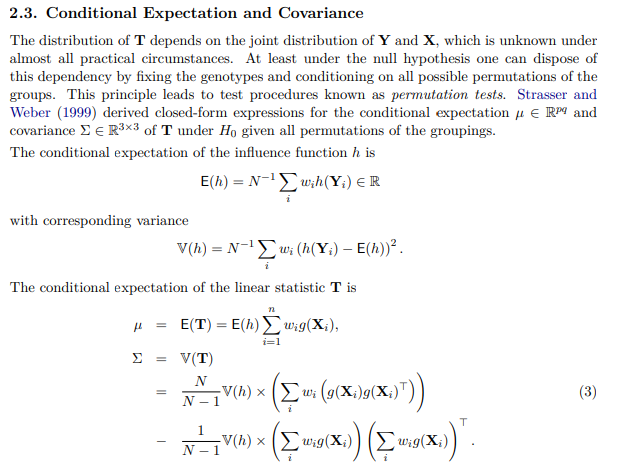
covariance(it)in terms ofiris$Petal.Length&iris$Sepal.Length?
Ultimately I want to write the first equation for my specific case of just one independent variable. I believe it comes down to $$ \frac{(t-\mu)^2}{\sigma^2} $$ where
- $ t = \sum (a \times b) $,
- $\mu = \frac{\sum a \times \sum b}{n}$ &
- $\sigma^2 = ?$.
I am looking for a formula for $\sigma$.
I guess this is described here: https://cran.r-project.org/web/packages/coin/vignettes/MAXtest.pdf, but I can't figure out how to rewrite $\sigma$ for my very simple case.
I thought this is the answer, but it is wrong
(n/(n-1)) *sum(iris$Petal.Length * iris$Sepal.Length) - (1/(n-1)) * sum(iris$Petal.Length) * sum(iris$Sepal.Length)
which would mean $\sigma^2$ is (but it is not)
$$ \frac{n}{n-1} \sum (a \times b) - \frac{1}{n-1} \times \sum a \times \sum b $$

