I am reading Machine Learning with PyTorch and Ski-kit learn book by Sebastian Raschka
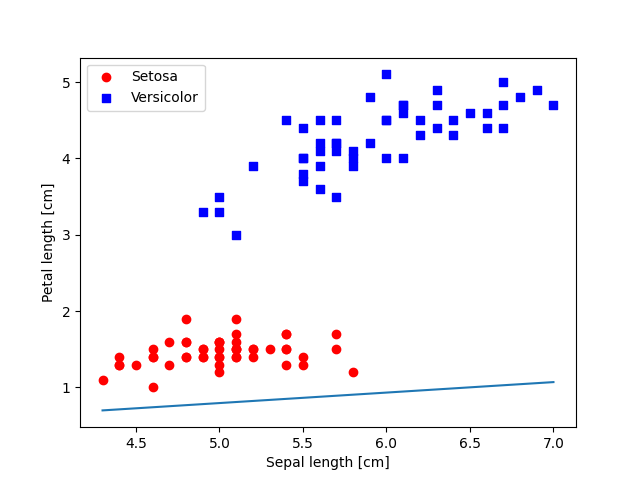
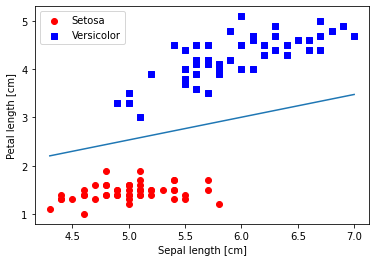
While plotting the decision boundary (a line in this case, since the number of features considered = 2) I can't find the bug in my code.
Adaline implementation:
    import numpy as np

    class AdalineGD:
        """Adaptive Linear Neuron classifier

        Parameters
        ------------
        eta : float
            Learning rate between 0.0 and 1.0

        n_iter : int
            Number of iterations over the training dataset

        random_state : int
            Random number generator seed for random weight initialization

        Attributes:
        ------------

        w_ : 1d-array
            Weights after fitting

        b_ : scalar
            Bias

        errors : list
            Mean squared loss error in each epoch/iteration

        """

        def __init__(self, eta=0.01, n_iter=50, random_state=1) -> None:
            self.eta = eta
            self.n_iter = n_iter
            self.random_state = random_state

        def fit(self, X, y):
            """Fit the training data

            Parameters
            ------------
            X : {array-like}, shape = [n_examples, n_features]
                Training vectors, where n_examples is the number of
                examples and n_features is the number of features.

            y : {array-like}, shape = [n_examples]
                Target values.

            Returns
            ------------
            self : object

            """
            rgen = np.random.RandomState(self.random_state)

            self.w_ = rgen.normal(loc=0.0, scale=0.01, size=X.shape[1])
            self.b_ = np.float_(0.0)
            self.losses_ = []

            for i in range(self.n_iter):
                net_input = self.net_input(X)
                # the identity function used as the activation function on the net_input
                output = self.activation(net_input)

                errors = (y - output) # size : (n_examples, 1)

                # update the weights and bias
                self.w_ += self.eta * 2.0 * X.T.dot(errors) / X.shape[0]
                self.b_ += self.eta * 2.0 * errors.mean()

                # calculate loss for the iteration
                loss = (errors**2).mean() # mean squared error loss
                print(f'At iter : {i} -> loss : {loss}')

                # keep track of loss for iteration
                self.losses_.append(loss)

            return self

        def net_input(self, X):
            return np.dot(X, self.w_) + self.b_

        def activation(self, X):
            """Compute Linear activation"""
            return X

        def predict(self, X):
            return np.where(self.activation(self.net_input(X)) >= 0.5 , 1, 0)
Loading iris dataset and plotting the parameters $w_1 , w_2$ and $b$ using the equation $$w_1*x_1 + w_2*x_2 + b = 0$$
Solving for $x_2$ : $$x_2 = (\frac{-w_1}{w_2}) * x_1 - (\frac{b}{w_2})$$
    import pandas as pd
    import numpy as np
    import matplotlib.pyplot as plt
    from matplotlib.colors import ListedColormap
    from perceptron import Perceptron
    from adaline import AdalineGD
    from sklearn.datasets import load_iris

    data, target = load_iris(return_X_y=True, as_frame=True)

    y = target.iloc[0:100]
    y = np.where(y == 0, 0, 1) # considering 2 classes
    X = data.iloc[0:100, [0,2]].values # 2 features [col 0, col 2]

    agd = AdalineGD(eta=0.01, n_iter=50)
    agd.fit(X, y)
    print(agd.w_, agd.b_)


    X1_min = X[:, 0].min()
    X1_max = X[:, 0].max()

    x1 = np.linspace(X1_min, X1_max, 100)
    x2 = (-(agd.w_[0]/agd.w_[1]) * x1 ) - (agd.b_ / agd.w_[1])

    #plot the training data
    plt.scatter(X[0:50, 0], X[0:50, 1] , color='red', marker='o', label='Setosa') # X[0:50, 0] 50 examples of feature 1 (col = 0) plotted with X[0:50, 1] 50 examples of feature 2 (col 1)
    plt.scatter(X[50:, 0], X[50:, 1] , color='blue', marker='s', label='Versicolor')

    #plot the line (which is the decision function)
    plt.plot(x1,x2)
    plt.xlabel('Sepal length [cm]')
    plt.ylabel('Petal length [cm]')
    plt.legend(loc='upper left')
    plt.show()
Clearly, the line isn't separating the two classes. What am I doing wrong?


