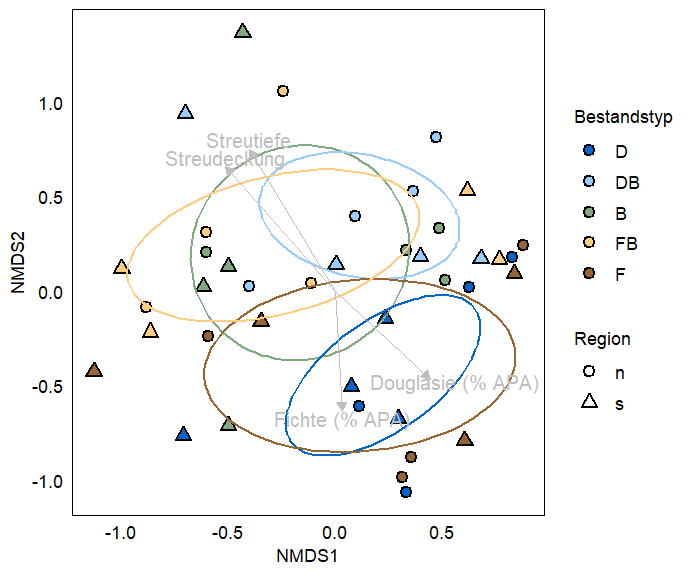
I sampled spiders in 5 different forest-stands. I originally had a sample size of 32 per forest-type, but as I had to pool the data I now just have 8 samples per forest type.
I did an ordination with spider-data in order to evalutate differences in the community structure (Index: Morisita-Horn). The colours reprensent the forest types, the triangle and circles the region. The ellipses show the standard deviation.
I want to find a way to see if the differences between the forest types and also between the regions are statistically significant. For that I wanted to use a Permanova (adonis2 from the vegan package).
I first checked if the dispersion varies significantly between the stands:
dispersion_stands <- betadisper(horn_dist, matrix_env_plot$stand, type="centroid")
anova(dispersion_stands)

Analysis of Variance Table

Response: Distances
          Df  Sum Sq  Mean Sq F value Pr(>F)
Groups     4 0.06117 0.015292  1.0219 0.4096
Residuals 35 0.52376 0.014965
which it does not. Same goes for 'region'.
I then proceeded by running the adonis2 function:
perma_stands_results <- adonis2(horn_dist~stand, data=matrix_env_plot, permutations=999)

> print(perma_stands_results)
Permutation test for adonis under reduced model
Terms added sequentially (first to last)
Permutation: free
Number of permutations: 999

adonis2(formula = horn_dist ~ stand, data = matrix_env_plot, permutations = 999)
         Df SumOfSqs      R2      F Pr(>F)
stand     4   1.8350 0.17689 1.8804  0.027 *
Residual 35   8.5387 0.82311
Total    39  10.3736 1.00000
---
Signif. codes:  0 ‘***’ 0.001 ‘**’ 0.01 ‘*’ 0.05 ‘.’ 0.1 ‘ ’ 1
>
according to which there are indeed signficant differences in the community structure between the forest types. I extracted distance matrixes for every pair and applied adonis2 again.
D_DB_test <- adonis2(D_DB_dist ~ stand, data=D_DB)
I also correct the p-values for multiple testing
> p.adjust(pairwise.p, method="BH")
      D_DB        D_B       D_FB        D_F       B_DB       B_FB        B_F       F_DB       F_FB
0.05666667 0.03000000 0.05666667 0.72000000 0.72000000 0.95400000 0.08600000 0.06250000 0.10166667
     DB_FB
0.86222222
my questions are:
- Is perfoming an anova the right way of analysing the global differences regarding differences in the dispersion? or do I first have to check if the assumptions that anova makes are violated (variance of homogenity...)
- Is running an Peranova for every pair of forest types a valid way of doing pairwise comparisons?
- Is it in any way problematic, that I only have 8 samples per group?
- Anova and the adonis function tell me that there are differnces in the community composition, but can I also draw a conclusion about the strength of the differences?
Thanks a lot, as you can see I am not an statistic expert, and really appreciate every explanation!

