1
$\begingroup$

I have no background in statistics so please be nice. With my little knowledge, I also did not find any similar posts or at least posts that I could understand.

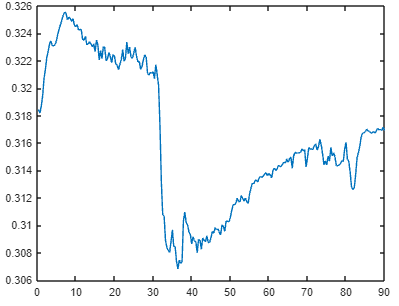
Here is my problem, I have a variety of signals with no clear trends that range from simple converging exponentials to what looks like a random walk with jumps (worst case), see below. These signals are noisy with a more or less constant noise that I know follows a normal distribution.

Real signal that I get

I want to measure the standard deviation of this noise, I am not interested in its mean because it's unstable.

I use a rather unconventional approach to estimate the standard deviation, but it works well enough. I have also quickly checked the maths; in theory, the output is the standard deviation. At the start, I was using the standard deviation of the moving standard deviation on 2 points with Bessel's correction i.e std(movstd(x,2,0),1) which can be simplified in the following code.

time = linspace(0,80,300)';
true_sigma = 1;
noise = true_sigma*randn(size(time));
true_sigma = std(noise);
process = cumsum(0.3*randn(size(time)));
jump_point = 50;
process(time>jump_point) = process(time>jump_point)+15;
signal = process+noise;

s_list = nan(size(time));
for k=1:length(time)
    d = gradient(signal(1:k));
    s_list(k) = std(d)*2/sqrt(2);
end
subplot(2,1,1);
plot(time,signal); grid on; xlim([time(1) time(end)]); title('Signal'); xlabel('Time (min)')
subplot(2,1,2);
plot(s_list); grid on; xlim([1 length(s_list)]); title('Estimated Standard Deviation'); xlabel('Samples'); yline(true_sigma,'--r');
legend('\sigma_{est}','\sigma_{true}')

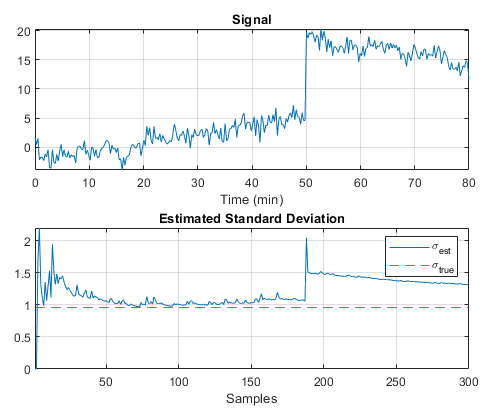
Here is the output of this code. The signal is representative of the worst-case scenario but is still likely to happen. You can see that when the signal jumps the estimated standard deviation jumps too and will take a long time to converge again.

Here is what I want : Solution 1: Be immune to this kind of jump OR mitigate them OR have a quicker convergence Solution 2: Have a confidence indicator that allows me to pick the best/most likely guess of the run.

I did look into the Bayesian interference, but to be honest I do not understand how to do it and I have no idea where to start.

Code output and signal example

Thank you for your help.

$\endgroup$
9
  • 1
    $\begingroup$ "These signals are noisy with a more or less constant noise that I know follows a normal distribution." How do you know this? (Because nothing in reality is really normal, chances are that actually you don't.) This may be a real problem because you might want to consider some deviations as "noise" that are clearly non-normal, and if you are assuming normality you may get these wrong. $\endgroup$ Commented Sep 23 at 12:26
  • 1
    $\begingroup$ Note also that there is no well defined distinction between signal and noise. You need some assumptions to distinguish them, which means that you need to decide, in advance, in some way how "smooth" your signal is supposed to be. Are you in fact happy with the "Signal" shown in your "Signal" plot? This has quite some variation that looks random, and in many applications people wouldn't want such a thing as "signal". $\endgroup$ Commented Sep 23 at 12:30
  • $\begingroup$ @ChristianHennig I know that it is a normal distribution because I managed (very rare) to get relatively stable data (constant) and the noise around was Gaussian, also the physics makes it so that even if it is not pure Gaussian noise it is very close. As for smoothing, that's what I was doing but it makes me reliant on assumptions/parameters that will not always be true and changes the output. P-S: I have almost 3000 "signals" so finding the ones that give me a hard time and are peculiar is a bit hard which is why the first picture may not represent the "best noise". $\endgroup$
    – Nadran
    Commented Sep 23 at 13:57
  • $\begingroup$ I have tested a lot of methods but the result were not satisfying: FFT, low/high-pass, B-splines,bézier splines, adaptative filters (LMS&RLMS), neural network, Kalman (direct approach), pooled variance, auto-regressive model, EMD and wavelets. I used the term "signal" but it is not really, it's just a non-predictable and non-controllable trend. with no real information in it. But as I said, I am not interested in this "signal" but in the "small" noise around it. So yeah, I am painfully fully aware of what you're saying and yet here I am. $\endgroup$
    – Nadran
    Commented Sep 23 at 13:57
  • $\begingroup$ PP-S : I have also checked my estimation on cases where strong smoothing is possible and confirmed that ~68% of the data points were within +/- sigma of the smoothing. $\endgroup$
    – Nadran
    Commented Sep 23 at 14:09

0

Your Answer

By clicking “Post Your Answer”, you agree to our terms of service and acknowledge you have read our privacy policy.