Note the qualification "in an observational setting".
Checking the context from which you've taken the quote (the subthread of comments that it is in), it looks like the intent is "in the real world" rather than in simulations, and probably doesn't include a controlled experiment ... and in that case, the likely intent is a consequence of the fact that the assumptions under which the intervals are derived don't actually quite hold. There are numerous things that can impact bias - which are of small effect compared to variability in small samples - but which generally don't reduce in size as sample size increases, while the standard errors do.
Since our calculations don't incorporate the bias, as intervals shrink (as $1/\sqrt n$), any unchanging bias, even if it's pretty small looms larger, leaving our intervals less and less likely to include the true value.
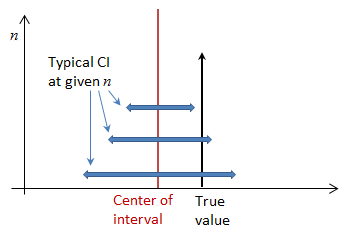
Here's an illustration - one which perhaps exaggerates bias - to indicate what I think is meant about CI coverage probability shrinking as sample size increases:

(Noting here that 'center of interval' refers to the center of the population of intervals, not the middle of any given sample's interval; the distance between the black and the red vertical lines is the bias, which is here being taken to be the same irrespective of sample size.)
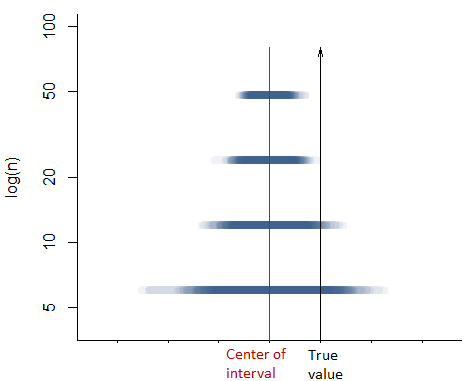
Of course in any particular sample, the interval will be random - it will be wider or narrower and shifted left or right relative to the diagram, so that at any sample size it has some coverage probability between 0 and 1, but any amount of bias will make it shrink toward zero as $n$ increases. Here's an example with 100 confidence intervals at each sample size using simulated data (plotted with transparency, so the color is more solid where more intervals cover it):


