24
$\begingroup$

I have a feeling this may have been asked elsewhere, but not really with the type of basic description I need. I know non-parametric relies on the median instead of the mean to compare... something. I also believe it relies on "degrees of freedom"(?) instead of standard deviation. Correct me if I'm wrong, though.

I've done pretty good research, or so I'd thought, trying to understand the concept, what the workings are behind it, what the test results really mean, and/or what to even do with the test results; however, no one seems to ever venture into that area.

For the sake of simplicity let's stick with the Mann-Whitney U-test, which I've noticed is quite popular (and also seemingly misused and overused too in order to force one's "square model into a circle hole"). If you'd like to describe the other tests as well feel free, although I feel once I understand one, I can understand the others in an analogous way towards various t-tests etc.

Let's say I run a non-parametric test with my data and I get this result back:

2 Sample Mann-Whitney - Customer Type       

Test Information        
H0: Median Difference = 0       
Ha: Median Difference ≠ 0       

Size of Customer    Large   Small
Count                    45    55
Median                    2     2

Mann-Whitney Statistic: 2162.00 
p-value (2-sided, adjusted for ties):   0.4156  

I'm familiar with other methods, but what is different here? Should we want the p-value to be lower than .05? What does the "Mann-Whitney statistic" mean? Is there any use for it? Does this information here just verify or not verify that a particular source of data I have should or should not be used?

I have a reasonable amount of experience with regression and the basics, but am very curious about this "special" non-parametric stuff - which I know will have it's own shortcomings.

Just imagine I'm a fifth grader and see if you can explain it to me.

$\endgroup$
8
  • 5
    $\begingroup$ Yes, I've read that many times. Sometimes the jargon that wikipedia uses can become overwhelming and although it has an accurate description - it does not necessarily have a clear description to someone who is starting to try to learn the area. Not sure who downvoted, but I legitimately want just a basic, CLEAR, explanation almost anyone could understand. Yes, I've tried hard to find one believe it or not. No need to instantly downvote me and link me to wikipedia. Anyone ever notice how some teachers are better than others? I'm looking for a good "teacher" for a concept I'm stuck on. $\endgroup$
    – Taal
    Commented Aug 12, 2013 at 21:52
  • 2
    $\begingroup$ Move on then to a good basic nonparametric statistics text such as Sprent and Smeeton, Hollander and Wolfe, Conover. or find an introductory text that includes Mann-Whitney. $\endgroup$
    – Nick Cox
    Commented Aug 12, 2013 at 22:02
  • 3
    $\begingroup$ The internet alone is actually working better than any book or class ever did for me to be honest - and that goes for any topic. I apologize for writing "chatty" questions. $\endgroup$
    – Taal
    Commented Aug 12, 2013 at 22:58
  • 5
    $\begingroup$ No it does not seem to be working as well as a good book. To paraphrase Stephen Senn, it is odd that statistics is the only science the people demand be understandable at first look. $\endgroup$ Commented Aug 13, 2013 at 12:14
  • 2
    $\begingroup$ I can see how in my asking of the question I was missing foundational pieces - like...alot of them. I was trying to shortcut. But seeing as this question has reached gold status recently....and the answers here manage to take the chaos and confusion I had, distill them out, and clearly answer them... That is what SE is about. Who can provide the best answer? $\endgroup$
    – Taal
    Commented Jun 24, 2022 at 7:52

5 Answers 5

50
$\begingroup$

I know non-parametric relies on the median instead of the mean

Hardly any nonparametric tests actually "rely on" medians in this sense. I can only think of a couple... and the only one I expect you'd be likely to have even heard of would be the sign test.

to compare...something.

If they relied on medians, presumably it would be to compare medians. But - in spite of what a number of sources try to tell you - tests like the signed rank test, or the Wilcoxon-Mann-Whitney or the Kruskal-Wallis are not really a test of medians at all; if you make some additional assumptions, you can regard the Wilcoxon-Mann-Whitney and the Kruskal-Wallis as tests of medians, but under the same assumptions (as long as the distributional means exist) you could equally regard them as a test of means.

The actual location-estimate relevant to the Signed Rank test is the median of pairwise averages within-sample (over $\frac12 n(n+1)$ pairs including self-pairs), the one for the Wilcoxon-Mann-Whitney is the median of pairwise differences across-samples.

I also believe it relies on "degrees of freedom?" instead of standard deviation. Correct me if I'm wrong though.

Most nonparametric tests don't have 'degrees of freedom' in the specific sense that the chi-squared or the t-test of the F-test do (each of which has to do with the number of degrees of freedom in an estimate of variance), though the distribution of many change with sample size and you might regard that as somewhat akin to degrees of freedom in the sense that the tables change with sample size. The samples do of course retain their properties and have n degrees of freedom in that sense but the degrees of freedom in the distribution of a test statistic is not typically something we're concerned with. It can happen that you have something more like degrees of freedom - for example, you could certainly make an argument that the Kruskal-Wallis does have degrees of freedom in basically the same sense that a chi-square does, but it's usually not looked at that way (for example, if someone's talking about the degrees of freedom of a Kruskal-Wallis, they will nearly always mean the d.f. of the chi-square approximation to the distribution of the statistic).

A good discussion of degrees of freedom may be found here/

I've done pretty good research, or so I've thought, trying to understand the concept, what the workings are behind it, what the test results really mean, and/or what to even do with the test results; however no one seems to ever venture into that area.

I'm not sure what you mean by this.

I could suggest some books, like Conover's Practical Nonparametric Statistics, and if you can get it, Neave and Worthington's book (Distribution-Free Tests), but there are many others - Marascuilo & McSweeney, Hollander & Wolfe, or Daniel's book for example. I suggest you read at least 3 or 4 of the ones that speak to you best, preferably ones that explain things as differently as possible (this would mean at least reading a little of perhaps 6 or 7 books to find say 3 that suit).

For the sake of simplicity lets stick with the Mann Whitney U test, which I've noticed is quite popular

It is, which is what puzzled me about your statement "no one seems to ever venture into that area" - many people who use these tests do 'venture into the area' you were talking about.

- and also seemingly misused and overused

I'd say nonparametric tests are generally underused if anything (including the Wilcoxon-Mann-Whitney) -- most especially permutation/randomization tests, though I wouldn't necessarily dispute that they're frequently misused (but so are parametric tests, even more so).

Let's say I run a non-parametric test with my data and I get this result back:

[snip...]

I'm familiar with other methods, but what is different here?

Which other methods do you mean? What do you want me to compare this to?

Edit: You mention regression later; I assume then that you are familiar with a two-sample t-test (since it's really a special case of regression).

Under the assumptions for the ordinary two-sample t-test, the null hypothesis has that the two populations are identical, against the alternative that one of the distributions has shifted. If you look at the first of the two sets of hypotheses for the Wilcoxon-Mann-Whitney below, the basic thing being tested there is almost identical; it's just that the t-test is based on assuming the samples come from identical normal distributions (apart from possible location-shift). If the null hypothesis is true, and the accompanying assumptions are true, the test statistic has a t-distribution. If the alternative hypothesis is true, then the test-statistic becomes more likely to take values that don't look consistent with the null hypothesis but do look consistent with the alternative -- we focus on the most unusual, or extreme outcomes (the ones most consistent with the alternative) - if they occur, we conclude that the samples we got would not have occurred by chance when the null was true (they could do, but the probability of a result at least that much consistent with the alternative is so low that we consider the alternative hypothesis a better explanation for what we observe than "the null hypothesis along with the operation of chance").

The situation is very similar with the Wilcoxon-Mann-Whitney, but it measures the deviation from the null somewhat differently. In fact, when the assumptions of the t-test are true*, it's almost as good as the best possible test (which is the t-test).

*(which in practice is never, though that's not really as much of a problem as it sounds)
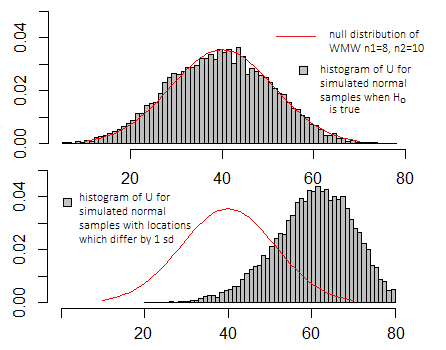
wmw under null and alternative

Indeed, it's possible to consider the Wilcoxon-Mann-Whitney as effectively a "t-test" performed on the ranks of the data - though then it doesn't have a t-distribution; the statistic is a monotonic function of a two-sample t-statistic computed on the ranks of the data, so it induces the same ordering on the sample space (that is a "t-test" on the ranks - appropriately performed - would generate the same p-values as a Wilcoxon-Mann-Whitney), so it rejects exactly the same cases.

[You'd think that just using the ranks would be throwing away a lot of information, but when the data are drawn from normal populations with the same variance, almost all the information about location-shift is in the patterns of the ranks. The actual data values (conditional on their ranks) add very little additional information to that. If you go heavier-tailed than normal, it's not long before the Wilcoxon-Mann-Whitney test has better power, as well as retaining its nominal significance level, so that 'extra' information above the ranks eventually becomes not just uninformative but in some sense, misleading. However, near-symmetric heavy-tailedness is a rare situation, outside some specific applications; what you often tend to see in practice is skewness.]

The basic ideas are quite similar, the p-values have the same interpretation (the probability of a result as, or more extreme, if the null hypothesis were true) -- right down to the interpretation of a location-shift, if you make the requisite assumptions (see the discussion of the hypotheses near the end of this post).

If I did the same simulation as in the plots above for the t-test, the plots would look very similar - the scale on the x- and y-axes would look different, but the basic appearance would be similar.

Should we want the p-value to be lower than .05?

You shouldn't "want" anything there. The idea is to find out if the samples are more different (in a location-sense) than can be explained by chance, not to 'wish' a particular outcome.

If I say "Can you go see what color Raj's car is please?", if I want an unbiased assessment of it I don't want you to be going "Man, I really, really hope it's blue! It just has to be blue". Best to just see what the situation is, rather than to go in with some 'I need it to be something'.

If your chosen significance level is 0.05, then you'll reject the null hypothesis when the p-value is ≤ 0.05. But failure to reject when you have a big enough sample size to nearly always detect relevant effect-sizes is at least as interesting, because it says that any differences that exist are small.

What does the "mann whitley" number mean?

The Mann-Whitney statistic.

There's meaning in comparing its value with the distribution of values it can take when the null hypothesis is true (see the above diagram), and that depends on which of several particular definitions any particular program might use.

Is there any use for it?

Usually you don't care about the exact value as such, but where it lies in the null-distribution (whether it's more or less typical of the values you should see when the null hypothesis is true, or whether it's more extreme)

(Edit: You can obtain or work out some directly informative quantities when doing such a test - like the location shift or $P(X<Y)$ discussed below, and indeed you can work out the second one fairly directly from the statistic, but the statistic alone isn't a very informative number)

Does this data here just verify or not verify that a particular source of data I have should or should not be used?

This test doesn't say anything about "a particular source of data I have should or should not be used".

See my discussion of the two ways of looking at the WMW hypotheses below.

I have a reasonable amount of experience with regression and the basics, but am very curious about this "special" non-parametric stuff

There's nothing particularly special about nonparametric tests (I'd say the 'standard' ones are in many ways even more basic than the typical parametric tests) -- as long as you actually understand hypothesis testing.

That's probably a topic for another question, however.


There are two main ways to look at the Wilcoxon-Mann-Whitney hypothesis test.

i) One is to say "I'm interested in location-shift - that is that under the null hypothesis, the two populations have the same (continuous) distribution, against the alternative that one is 'shifted' up or down relative to the other"

The Wilcoxon-Mann-Whitney works very well if you make this assumption (that your alternative is just a location shift)

In this case, the Wilcoxon-Mann-Whitney actually is a test for medians ... but equally it's a test for means, or indeed any other location-equivariant statistic (90th percentiles, for example, or trimmed means, or any number of other things), since they're all affected the same way by location-shift.

The nice thing about this is that it's very easily interpretable -- and it's easy to generate a confidence interval for this location-shift.
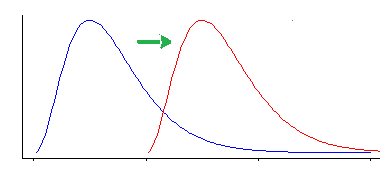
location shift

However, the Wilcoxon-Mann-Whitney test is sensitive to other kinds of difference than a location shift.

ii) The other is to take the fully general approach. You can characterize this as a test for the probability that a random value from population 1 is less than a random value from population 2 (and indeed, you can turn your Wilcoxon-Mann-Whitney statistic into a direct estimate of that probability, if you're so inclined; the Mann&Whitney formulation in terms of U-statistics counts the number of times one exceeds the other in the samples, you only need scale that to achieve an estimate of the probability); the null is that the population probability is $\frac{1}{2}$, against the alternative that it differs from $\frac{1}{2}$.
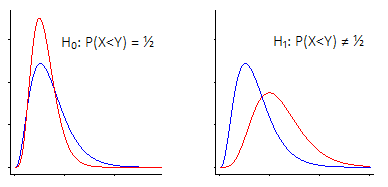
shift in P(X<Y) from 1/2

However, while it can work okay in this situation, the test is formulated on the assumption of exchangability under the null. Among other things that would require that in the null case the two distributions are the same. If we don't have that, and are instead are in a slightly different situation like the one pictured above, we won't typically have a test with significance level $\alpha$. In the pictured case it would likely be a bit lower.

So while it "works" in the sense that it tends not to reject when $H_0$ is true and tends to reject more when $H_0$ is false, you want the distributions to be pretty close to identical under the null or the test doesn't behave the way we would expect it to.

$\endgroup$
4
  • $\begingroup$ I drew the approximate null distribution (the one in red in the new topmost graph) in as if it's continuous ... but the actual distribution is discrete. The picture is less cluttered that way. $\endgroup$
    – Glen_b
    Commented Aug 13, 2013 at 4:13
  • 3
    $\begingroup$ +1 Great answer. One of the best and most accessible explanations of the Wilcoxon-Mann-Whitney test I know. Thank you. $\endgroup$ Commented Aug 13, 2013 at 6:14
  • $\begingroup$ "In this case, the Wilcoxon-Mann-Whitney actually is a test for medians ... but equally it's a test for means" However, some distributions don't have means whereas their median is well-defined (e.g. Cauchy). $\endgroup$
    – caracal
    Commented Feb 25, 2014 at 7:18
  • $\begingroup$ @caracal While true (it's a point I've made a number of times here), if someone's testing for equality of population means, presumably they already assume they population means are finite. If they don't, they have a problem well before they get to the point of choosing a test. Taking as given that there's a hypothesis of equal (and thereby finite) population means, under the same assumptions that are usually used in order to make it a test of medians (shift alternatives), the WMW is also a test of means. $\endgroup$
    – Glen_b
    Commented May 17, 2017 at 4:06
19
$\begingroup$

Suppose you and I are coaching track teams. Our athletes come from the same school, are similar ages, and the same gender (i.e., they're drawn from the same population), but I claim to have discovered a Revolutionary New Training System that will make my team members run much faster than yours. How can I convince you that it really does work?

We have a race.

Afterward, I sit down and compute the average time for the members of my team and the average time for the members of yours. I'll claim victory if the mean time for my athletes is not only faster than the mean for yours, but the difference is also large compared to the "scatter", or standard deviation, of our results.


This is essentially a [$t$-test][1]. We're assuming that the data arises from distributions with specific parameters, in this case a mean and standard deviation. The test estimates those parameters and compares one of them (the mean). It is, consequently, called a parametric test, since we are comparing these parameters.


"But Matt", you complain, "this isn't quite fair. Our teams are pretty similar, but you--due to pure chance--ended up with the fastest runner in the district. He's not in the same league as everyone else; he's practically a freak of Nature. He finished 3 minutes before the next-fastest finisher, which reduces your average time a lot, but the rest of the competitors are pretty evenly mixed. Let's look at the finish order instead. If your method really works, the earlier finishers should mostly be from your team, but if it doesn't the finish order should be pretty random. This doesn't give undue weight to your super-star!"


This method is essentially the [Mann-Whitney U Test][2] (also called the Wilcoxon Rank Sum Test, Manning-Whitney-Wilcoxon Test, and several other permutations besides!). Note that unlike the $t$-test, we're not assuming that the data comes from specific distributions, nor are we computing any parameters for them. Instead, we're comparing the relative ranks of the data points directly.

That's the major distinction--parametric tests model things with distributions and compare the parameters of these distributions; non-parametric tests....don't and operate more directly on the data. As with parametric tests, non-parametric test statistics are also constructed so that the $p$ values are uniformly distributed on [0,1] under the null hypothesis and clustered towards 0 in the presence of an effect. You would report and interpret them just like the results of a parametric test.

I'm not sure about the relative popularity of parametric and non-parametric methods. Some non-parametric methods (e.g., histograms!) are in nearly universal use; others might be over or under-used. I suspect that the Mann-Whitney U Test ought to be used more, rather than less frequently. It's about as efficient as a $t$-test on normally distributed data and actually does better than the $t$-test on sufficiently non-normal data. It's also fairly robust to outliers. Plus, you can use it on ordinal data too (e.g., finish order rather than just finish time), which makes it more broadly applicable than a $t$-test.

$\endgroup$
4
  • $\begingroup$ You actually answered my question exactly the way, and I mean exactly, the way I wanted it to be answered. Glen edged on the mathematical side more too, and the combination of these two responses made the click for me. I can't take the reward away from him though - I mean...he's drawing graphs, despite the clarity of your response. I have a feeling you've had some sort of teaching job in the past. I know there may be some generalizations in the responses here, but I knew I didn't have to buy a book and study it intensely to begin to be able to practically apply non-parametrics on some level $\endgroup$
    – Taal
    Commented Aug 13, 2013 at 1:39
  • $\begingroup$ Aww thanks! I'm not quite ready for a faculty job yet, but I'd like one down the line. FWIW, I think @Glen_b's answer is quite good! Neither of us came out and said this explicitly, but if you're on the fence between a rank sum and a $t$-test, go with the rank sum. I think part of the t-test's popularity is how it fits in nicely with the themes of Stats 101, rather than any intrinsic fitness-for-purpose. Anyway, good luck and feel free to post more questions as they pop up! $\endgroup$ Commented Aug 13, 2013 at 3:34
  • $\begingroup$ The irony of all this is that I'm not going to use it at all probably, it just bothered me that I couldn't get a straight answer on what it was. Glen's answer is so much more than I expected and got originally - the best answers I feel I can't describe as any description would prove inadequate. Like telling someone what the color blue looks like. If you've read any of whuber's stuff, it sounds like you may have a similar flavor... $\endgroup$
    – Taal
    Commented Aug 13, 2013 at 5:14
  • $\begingroup$ see stats.stackexchange.com/questions/18058/… $\endgroup$
    – Taal
    Commented Aug 13, 2013 at 5:15
7
$\begingroup$

You asked to be corrected if wrong. Here are some comments under that heading to complement @Peter Flom's positive suggestions.

  • "non-parametric relies on the median instead of the mean": often in practice, but that's not a definition. Several non-parametric tests (e.g. chi-square) have nothing to do with medians.

  • relies on degrees of freedom instead of standard deviation; that's very confused. The idea of degrees of freedom is in no sense an alternative to standard deviation; degrees of freedom as an idea applies right across statistics.

  • "a particular source of data I have should or should not be used": this question has nothing to do with the significance test you applied, which is just about the difference between subsets of data and is phrased in terms of difference between medians.

$\endgroup$
1
  • $\begingroup$ I believe your take on me asking to "be corrected where wrong" has been the best response so far. I suppose I needed a few null hypothesis refuted or to learn by process of elimination. Your response has given me new information I understand - there are still some big holes in my understanding of the topic, but I can't expect perfection. Perhaps those holes are bigger than I originally anticipated when writing this question and stackexchange wouldn't suffice, no matter how "chatty" I made the question. $\endgroup$
    – Taal
    Commented Aug 12, 2013 at 23:28
4
$\begingroup$

You "want" the same things from a p-value here that you want in any other test.

The U statistic is the result of a calculation, just like the t statistic, the odds ratio, the F statistic, or what have you. The formula can be found lots of places. It's not very intuitive, but then, neither are other test statistics until you get used to them (we recognize a t of 2 as being in the significant range because we see them all the time).

The rest of the output in your block text should be clear.

For a more general introduction to nonparametric tests, I echo @NickCox .... get a good book. Non-parametric simply means "without parameters"; there are many non-parametric tests and statistics for a wide variety of purposes.

$\endgroup$
4
  • $\begingroup$ Yes, ideally, a good book would help; however, it seems unnecessary with today's resources (like stackexchange), wikipedia (sometimes), youtube market competition (did you know for each million views someone gets they get paid $4000?), as well as a variety of other resources. I generally, just as my learning style, fail pretty hard at simple book learning as well. $\endgroup$
    – Taal
    Commented Aug 12, 2013 at 22:50
  • 1
    $\begingroup$ I appreciate your post, however it actually already reiterates most of what I already know or had assumed unfortunately. There seems to be some sort of pattern where almost every explanation I get stops at this one specific point. Perhaps this point is where it becomes too complex to explain or too much effort - I'm not sure. Either way, it is a pattern I've been experiencing from every source of information I normally use - which would ironically reiterate everyone's book statement. Perhaps I did not realize the answer was so complex; then again I've seen some intense answer on SE. $\endgroup$
    – Taal
    Commented Aug 12, 2013 at 22:55
  • 2
    $\begingroup$ First you ask us to simplify, then you complain that our answers are simple! If you want to understand the formula for U (or anything else) LOOK at it. If you want something simple, then don't ask for complexities! The Wikipedia entry is an excellent, detailed entry with all the details. You don't understand it. So. What do you want? $\endgroup$
    – Peter Flom
    Commented Aug 12, 2013 at 23:09
  • 1
    $\begingroup$ I suppose somewhere in between. I admittedly am not the best at communicating, and I can understand you're frustration, heh. It's a trait of mine I actually am very aware of. To be honest, I think I'll have to think about what I really want - as it's almost like I'm trying to nudge the question enough to where it overlaps into an area I wasn't aware of or didn't previously know about. It's hard to ask about something you don't understand in general. I'll just have to come back to this I suppose. $\endgroup$
    – Taal
    Commented Aug 12, 2013 at 23:18
2
$\begingroup$

As a response to a recently closed question, this addresses the above as well. Below is a quote from Bradley's classic Distribution-Free Statistical Tests (1968, p. 15–16) which, while a bit long, is a pretty clear explanation, I believe.

The terms nonparametric and distribution-free are not synonymous, and neitherterm provides an entirely satisfactory description of the class of statistics to which they are intended to refer.…Roughly speaking, a nonparametric test is one which makes no hypothesis about the value of a parameter in a statistical density function, whereas a distribution-free test is one which makes no assumptions about the precise form of the sampled population. The definitions are not mutually exclusive, and a test can be both distribution-free and parametric.…In order to be entirely clear about what is meant by distribution-free, it is necessary to distinguish between three distributions: (a) that of the sampled population; (b) that of the observation-characteristic actually used by the test; and (c) that of the test statistic. The distribution from which the tests are "free" is that of (a), the sampled population. And the freedom they enjoy is usually relative.…However the assumptions are never so elaborate as to imply a population whose distribution is completely specified.…The reason…is very simple: the magnitudes are not used as such in the [nonparametric] test, nor is any other strongly-linked population attribute of the variate. Instead sample-linked charachteristics of the obtained observations…provide the informatikon used by the test statistic.…Thus while both parametric and nonparametric tests require that the form f a distribution, associated with observations, be fully known, that knowledge, in the parametric case, is generally not forthcoming ad the required distribution of magnitudes must therefore be "assumed" or inferred on the basis of approximate or incomplete information. In the nonparametric case, on the other and, the distrbution of the observation characteristic is usually known precisely from a priori considerations and need not, therefore, be "assumed." The difference, then, is not one of requirement but rather of what is required and of certainty that the requirement will be met.

$\endgroup$

Your Answer

By clicking “Post Your Answer”, you agree to our terms of service and acknowledge you have read our privacy policy.

Not the answer you're looking for? Browse other questions tagged or ask your own question.