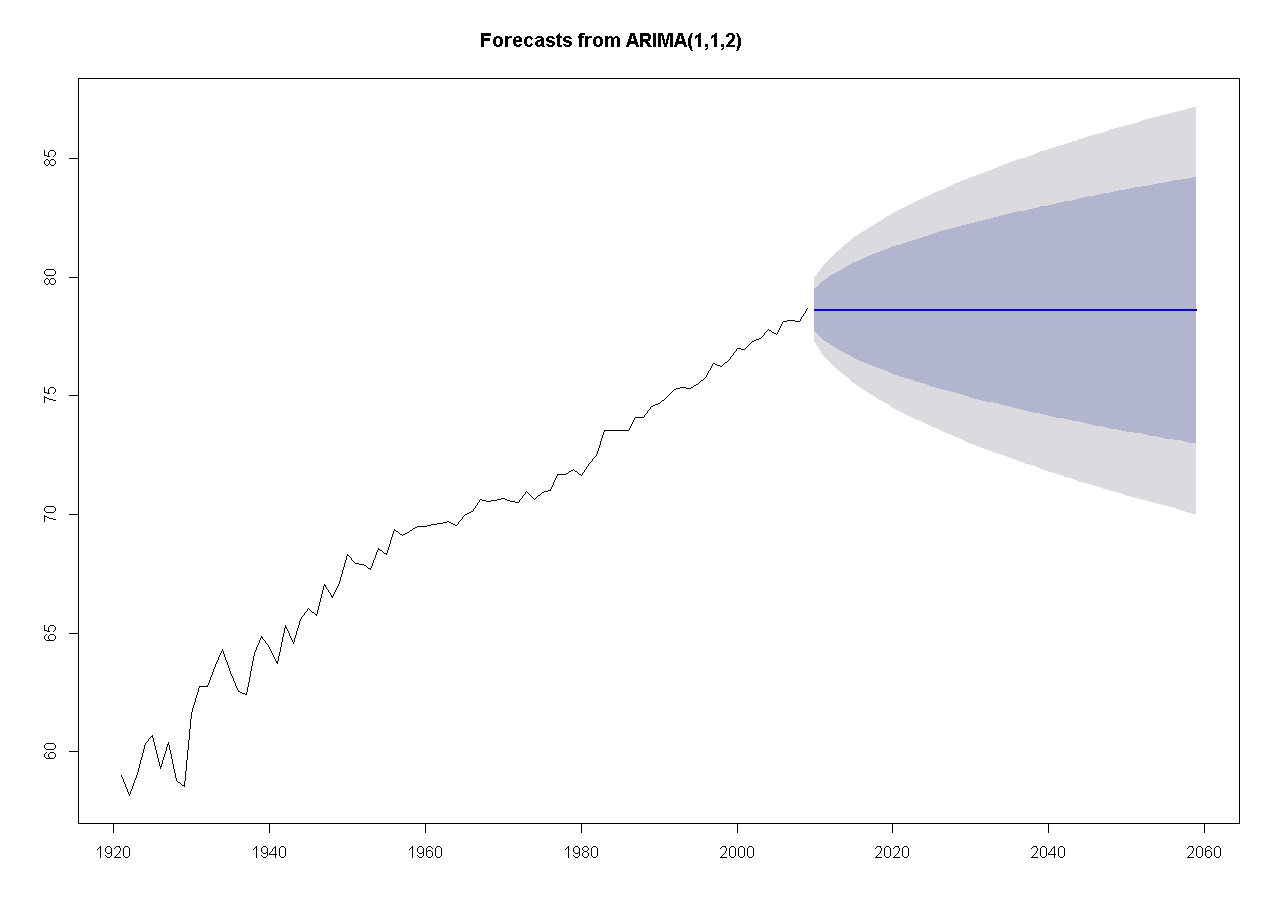
I'm working on the forecasting of life expectancy actually. I have written code following the usual procedure. The results are not trustworthy because the life expectancy should have a positive slope (logically) but in my case it comes flat for the 50 years ahead.
The ARIMA(1,1,2) is the best model with the lowest AICc. I'm in trouble with the point forecast where the straight line is flat. How do you think I can modify my code in order to get more powerful results

Here you find my code and the plot. The life expectancy is I(1). I have differenced it and the first difference is I(0). The first difference of life expectancy is stationary. Then I got the best model with the lowest AICc and forecast the the life expectancy level.
library(forecast)
AA<-Alberta$Male
AA1<-ts(AA,start=1921,end=2009,frequency=1)
A2<-diff(AA1,1)
fit1<-arima(A2, order=c(1,1,0))
fit2 <-arima(A2, order=c(1,1,1))
fit3<-arima(A2, order=c(1,1,2))
fit4<-arima(A2,order=c(2,1,0))
fit5<-arima(A2,order=c(2,1,1))
fit6<-arima(A2,order=c(2,1,2))
fit1
fit2
fit3
fit4
fit5
fit6
fit15<-arima(AA1,order=c(1,1,2))
ARIMA50ALBERTA<-forecast(fit15,50)
plot(ARIMA50ALBERTA)
These are the results:
 Point     Forecast    Lo 80    Hi 80    Lo 95    Hi 95
2010       78.63251 77.74617 79.51885 77.27697 79.98806
2011       78.59585 77.37187 79.81984 76.72393 80.46778
2012       78.61099 77.16457 80.05740 76.39888 80.82309
2013       78.60474 76.95134 80.25814 76.07608 81.13340
2014       78.60732 76.77553 80.43911 75.80584 81.40880
2015       78.60625 76.60992 80.60259 75.55312 81.65938
2016       78.60669 76.45917 80.75422 75.32234 81.89105
2017       78.60651 76.31746 80.89557 75.10570 82.10732
2018       78.60659 76.18437 81.02880 74.90213 82.31104
2019       78.60656 76.05809 81.15502 74.70901 82.50410
2020       78.60657 75.93783 81.27531 74.52509 82.68805
2021       78.60656 75.82274 81.39039 74.34907 82.86405
2022       78.60657 75.71223 81.50090 74.18006 83.03307
2023       78.60656 75.60578 81.60734 74.01727 83.19586
2024       78.60656 75.50299 81.71014 73.86006 83.35307
2025       78.60656 75.40349 81.80964 73.70789 83.50524
2026       78.60656 75.30699 81.90614 73.56030 83.65283
2027       78.60656 75.21323 81.99990 73.41691 83.79622
2028       78.60656 75.12200 82.09113 73.27738 83.93575
2029       78.60656 75.03309 82.18004 73.14141 84.07172
2030       78.60656 74.94635 82.26678 73.00874 84.20439
2031       78.60656 74.86161 82.35152 72.87915 84.33398
2032       78.60656 74.77874 82.43439 72.75242 84.46071
2033       78.60656 74.69764 82.51549 72.62838 84.58475
2034       78.60656 74.61818 82.59495 72.50686 84.70627
2035       78.60656 74.54027 82.67286 72.38771 84.82542
2036       78.60656 74.46383 82.74930 72.27080 84.94233
2037       78.60656 74.38878 82.82435 72.15602 85.05711
2038       78.60656 74.31504 82.89809 72.04324 85.16989
2039       78.60656 74.24254 82.97059 71.93236 85.28077
2040       78.60656 74.17123 83.04190 71.82330 85.38983
2041       78.60656 74.10104 83.11209 71.71596 85.49717
2042       78.60656 74.03193 83.18119 71.61027 85.60286
2043       78.60656 73.96386 83.24927 71.50615 85.70698
2044       78.60656 73.89676 83.31637 71.40354 85.80959
2045       78.60656 73.83061 83.38252 71.30237 85.91076
2046       78.60656 73.76536 83.44777 71.20258 86.01055
2047       78.60656 73.70098 83.51215 71.10412 86.10901
2048       78.60656 73.63743 83.57570 71.00694 86.20619
2049       78.60656 73.57469 83.63844 70.91098 86.30215
2050       78.60656 73.51272 83.70041 70.81620 86.39693
2051       78.60656 73.45149 83.76164 70.72256 86.49057
2052       78.60656 73.39098 83.82214 70.63002 86.58311
2053       78.60656 73.33117 83.88196 70.53855 86.67458
2054       78.60656 73.27203 83.94110 70.44810 86.76503
2055       78.60656 73.21353 83.99960 70.35864 86.85449
2056       78.60656 73.15567 84.05746 70.27014 86.94299
2057       78.60656 73.09841 84.11472 70.18257 87.03056
2058       78.60656 73.04174 84.17139 70.09590 87.11723
2059       78.60656 72.98564 84.22749 70.01010 87.20303

arimain R - one is to fit an ARIMA(1,0,2) to the differences, and another is to use the time index in thexregargument. I'm not sure why they don't allow you to setinclude.mean=TRUEon an integrated model to fit the drift, but that's how it is. Some of the other packages/functions that fit time series probably allow it more directly. $\endgroup$