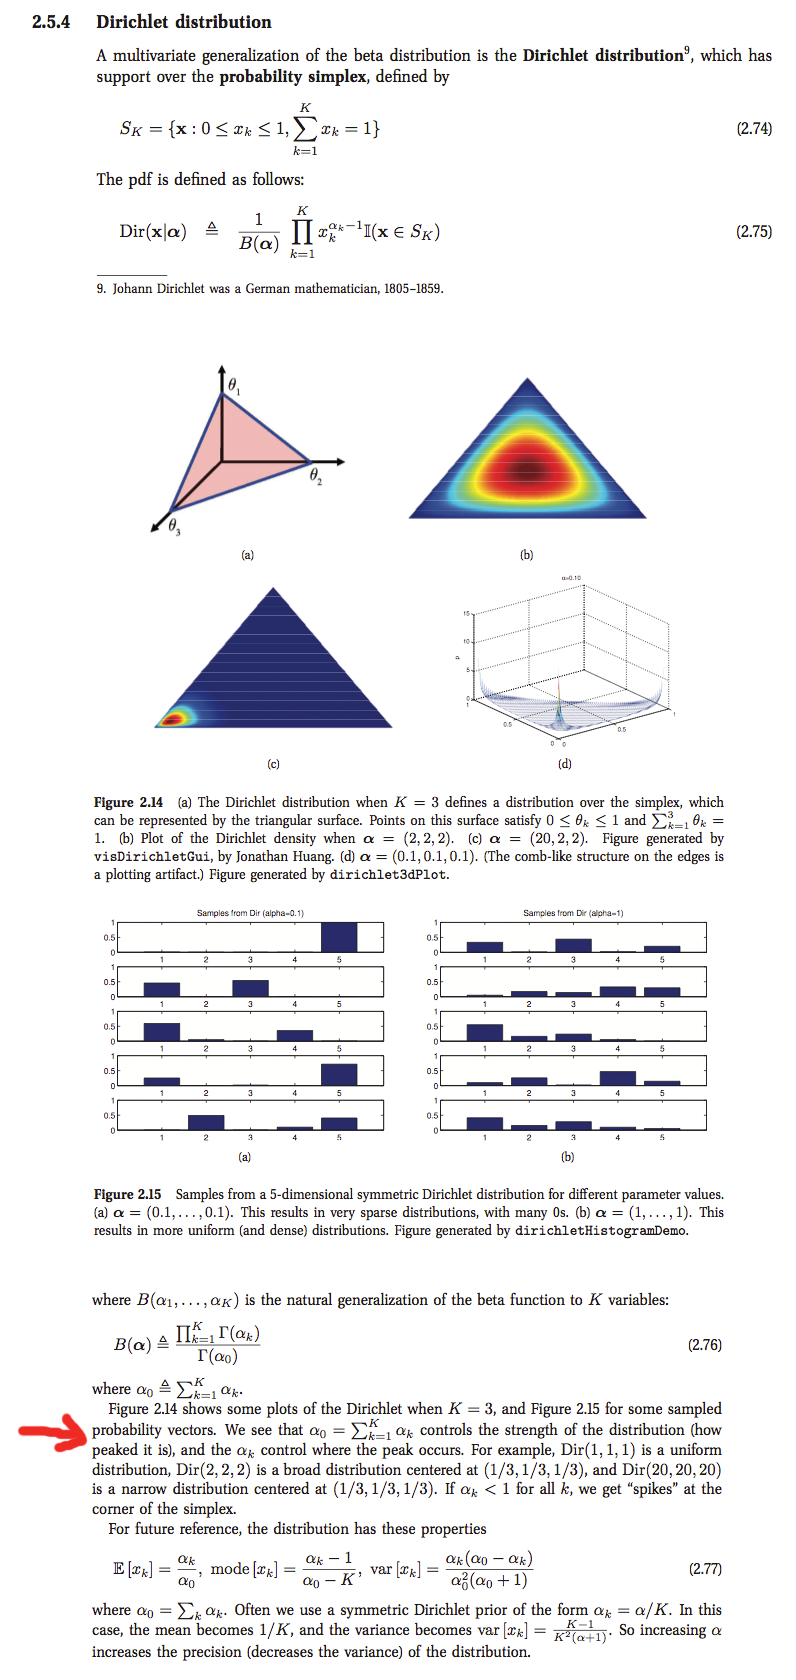
I'm reading from a book that introduces the Dirchilet distribution and then presented figures about it. But I was not really able to understand those figures. I attached the figure here at the bottom. What I don't understand are the meanings of the triangles.
Normally when one wants to plot a function of 2 variables, you take the value of var1 and va2 and then plot the value of the function value of those two variables ... which gives a visualization in a 3D dimension. But here there are 3 dimensions and one other value for the function value so it makes a visualization in 4D space. I can't understand those figures!
I hope someone can clarify them please!
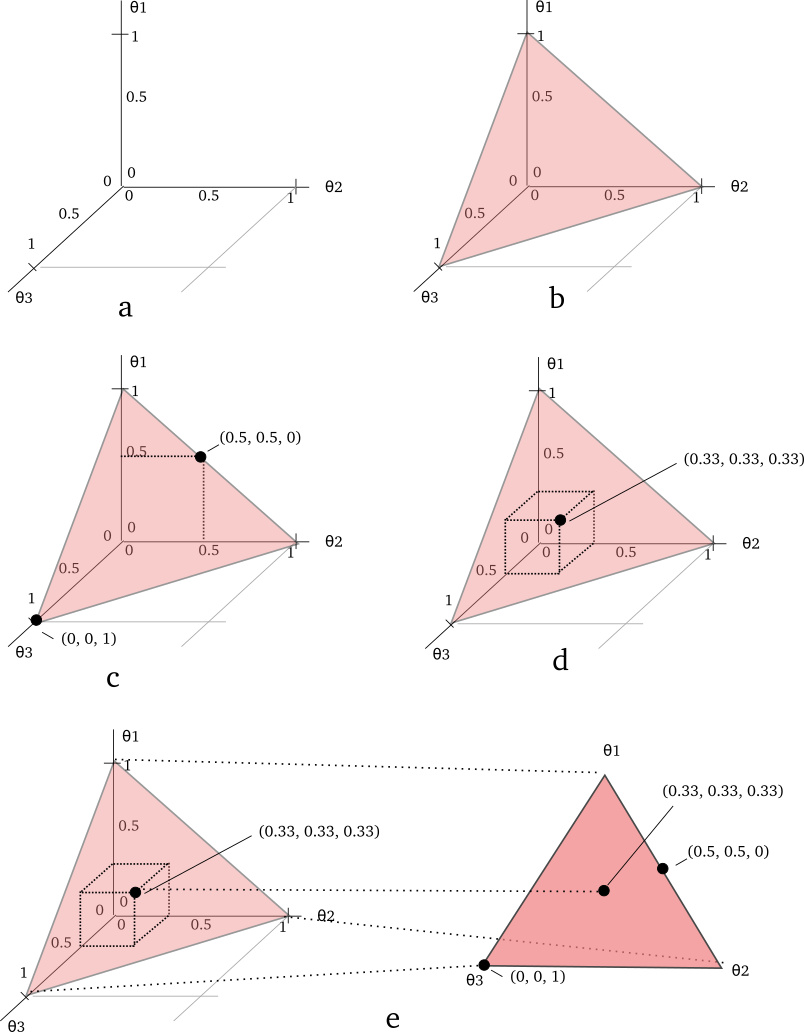
EDIT: here is what I don't understand from figure 2.14a. So we have drawn from K=3 dirichlet a sample theta (which is basically a vector) that is: theta = [theta1, theta2, theta3]. The triangle plots [theta1, theta2, theta3]. The distance from the origin to each theta_i is the value of theta_i. Then for each theta_i it put a vertex and connected all three verteces and made a triangle. I know that if I plug [theta1, theta2, theta3] into dir(theta|a) I will get one number which is the joint probability of the vector theta. I also understand that the probability for continuous random variables is a measure of an area. But here we have 3 dimensions so the joint probability will be the measure of the volume of the space from the pink plane and under ... i.e the pyramid. Now I don't understand what is the role of the triangle here. What is it trying to communicate or visualize?


