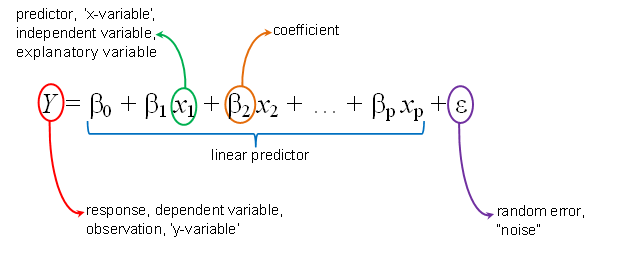
I'd planned to link to an answer with a good list (with discussion) of the regression assumptions an answer with the multiple regression assumptions, but I can't find a completely suitable one for what I had in mind. There are plenty of discussions of the issues (especially in comments), but not quite everything I think is needed in one place.
The regression model looks like this:

Most of the regression assumptions relate to the error component(s) of the model.
So, time for the multiple regression assumptions. [Formal hypothesis testing of the assumptions is generally not recommended - it mostly answers the wrong question, for starters. Diagnostic displays (residual plots for example) are commonly used.]
This is a typical way to organize the list, but depending on how you frame things, people may add more or put them together a bit differently. Approximately in order of importance:
0. To fit a regression doesn't require these assumptions, except perhaps (arguably) the first. The assumptions potentially matter when doing hypothesis tests and producing confidence intervals and - most importantly - prediction intervals (for which several of them matter a fair bit).
The model for the mean is correct ("Linearity"). The model is assumed to be linear in the (supplied) predictors and linear in the parameters*. (NB A quadratic model, or even a sinusoidal model, for example, can still be linear in the predictors, if you supply the right ones.)
*(and in most situations, that all the important terms are included)
This might be checked by examining residuals against fitted values, or against any independent variables that might have non-linear relationships; added-variable plots could be used to see whether any variables not in the model are important.
The $x$'s are observed without error
This generally isn't something you can assess by looking at the data set itself; it will usually proceed from knowing something about the variables and how they're collected. A person's height might be treated as fixed (even though the measurement of it is subject to both variation over time and measurement error) - the variation is very small, but for example a person's blood pressure is typically much more variable - if you measured a second time a little later, it might be quite different.
Constant error variance ("homoskedasticity").
This would normally be assessed either: (i) by looking at residuals against fitted (to check for variance related to the mean), or against variates that the error variance is particularly expected to be related to; or (ii) looking at some function of squared residuals (as the best available measure of observation variance) against the same things.
For example, one of the default diagnostic displays for R's linear regression is a plot of $\sqrt{|r_i|}$ vs fitted values, where $r_i$ is the standardized residual, which would be the fourth root of the squared standardized residuals. This transformation is mostly used to make the distribution less skew, facilitating comparisons without being dominated by the largest values but it also serves a purpose in not making relatively moderate changes in spread look very dramatic as they might with sat squared residuals.
Independence. The errors are assumed to be independent of each other (and of the $x$'s).
There are many ways that errors can exhibit dependence; you generally need some prior expectation of the form of dependence to assess it. If the data are observed over time (or along some spatial dimension), serial dependence would be an obvious thing to check for (perhaps via a sample autocorrelation function plot).
The errors are assumed to be normal (with zero mean).
The assumption about zero mean overall is uncheckable, since any non-zero mean is absorbed into the intercept (constant) term. Locally nonzero-mean would show up in the plot of residuals vs fitted plot as a lack of fit. The assumption of normality might be assessed (for example) via a Q-Q plot.
In larger samples, the last assumption becomes much less important, except for prediction intervals (where it always matters for the usual normal-theory inference).
Note that the collection of dependent variables ($Y$'s) is not assumed to be normal. At any given combination of $x$-values (IVs) they are normal, but the whole sample of $Y$'s will then be a mixture of normals with different means ... and - depending on the particular collection of combination of independent variable values, that might be very non-normal.
Which is to say, there's no point looking at the distribution of the IV to assess the normality assumption, because that's not what is assumed normal. The error term is assumed normal for the most usual forms of inference, which you estimate by the residuals.
Note that it's not required to assume normality even to perform inference; there are numerous alternatives that allow inference either via hypothesis tests (e.g. a permutation test) or confidence intervals (e.g. bootstrap intervals or intervals based on nonparametric correlation between residuals and predictor) and the relationship between the two forms of inference; there's also different parametric assumptions that can be accommodated with linear regression (e.g. fitting a Poisson or gamma GLM with identity link.
Examples of non-normal theory fits:
(a) One is illustrated here -- the red line in the plot there is the linear regression fitted using a Gamma GLM (a parametric assumption); tests of coefficients are easy to obtain from GLM output; this approach also generalizes to "multiple regression" easily.
(b) This answer shows estimated lines based on nonparametric correlations; tests and intervals can be generated for those.
A big problem with transforming to achieve normality
Let's say all the other regression assumptions are reasonable, apart from the normality assumption.
Then you apply some nonlinear transformation in the hopes of making the residuals look more normal.
Suddenly, your previously linear relationships are no longer linear.
Suddenly your spread of points about the fit is no longer constant.
Two assumptions that may matter much more than normality are no longer appropriate.

