2
$\begingroup$

I have pre- and post-treatment continuous data for a large number of variables that I am analyzing for treatment effect. Normally I would obtain the P values and then adjust them for multiple testing with a method such as Benajmini-Hochberg.

However, the statistical test that I am using is somewhat computationally intensive. To reduce this load, I am thinking of first filtering the data by removing variables for which the average effect size is less than 2-fold in either direction; i.e., mean(absolute(log2(post/pre))) <1.

Will such filtering of data by effect size violate some assumption of P value adjustment methods? It seems that the filtering is likely to enrich for variables for which a truly positive treatment effect exists.

$\endgroup$

2 Answers 2

2
$\begingroup$

Yes, a filter like that indeed introduces bias to the multiple testing procedure, because the remaining p-values are no longer uniformly distributed on [0,1] under the null hypothesis. Here is a paper about it:

Van Iterson, M., Boer, J. M., & Menezes, R. X. (2010). Filtering, FDR and power. BMC Bioinformatics, 11:450. Retrieved from http://www.biomedcentral.com/1471-2105/11/450.

$\endgroup$
1
  • $\begingroup$ In the work cited above, the authors test three types of filtering, by effect size (average inter-group fold-change), by value or signal (mean across all samples), or by variance (across all samples). With both simulated and real gene expression data, the effect size filter improved the power but also introduced FDR bias. The signal and variance filters, which were independent of inter-group differences, did not introduce significant FDR bias. $\endgroup$
    – user4045
    Commented Feb 21, 2014 at 23:15
0
$\begingroup$

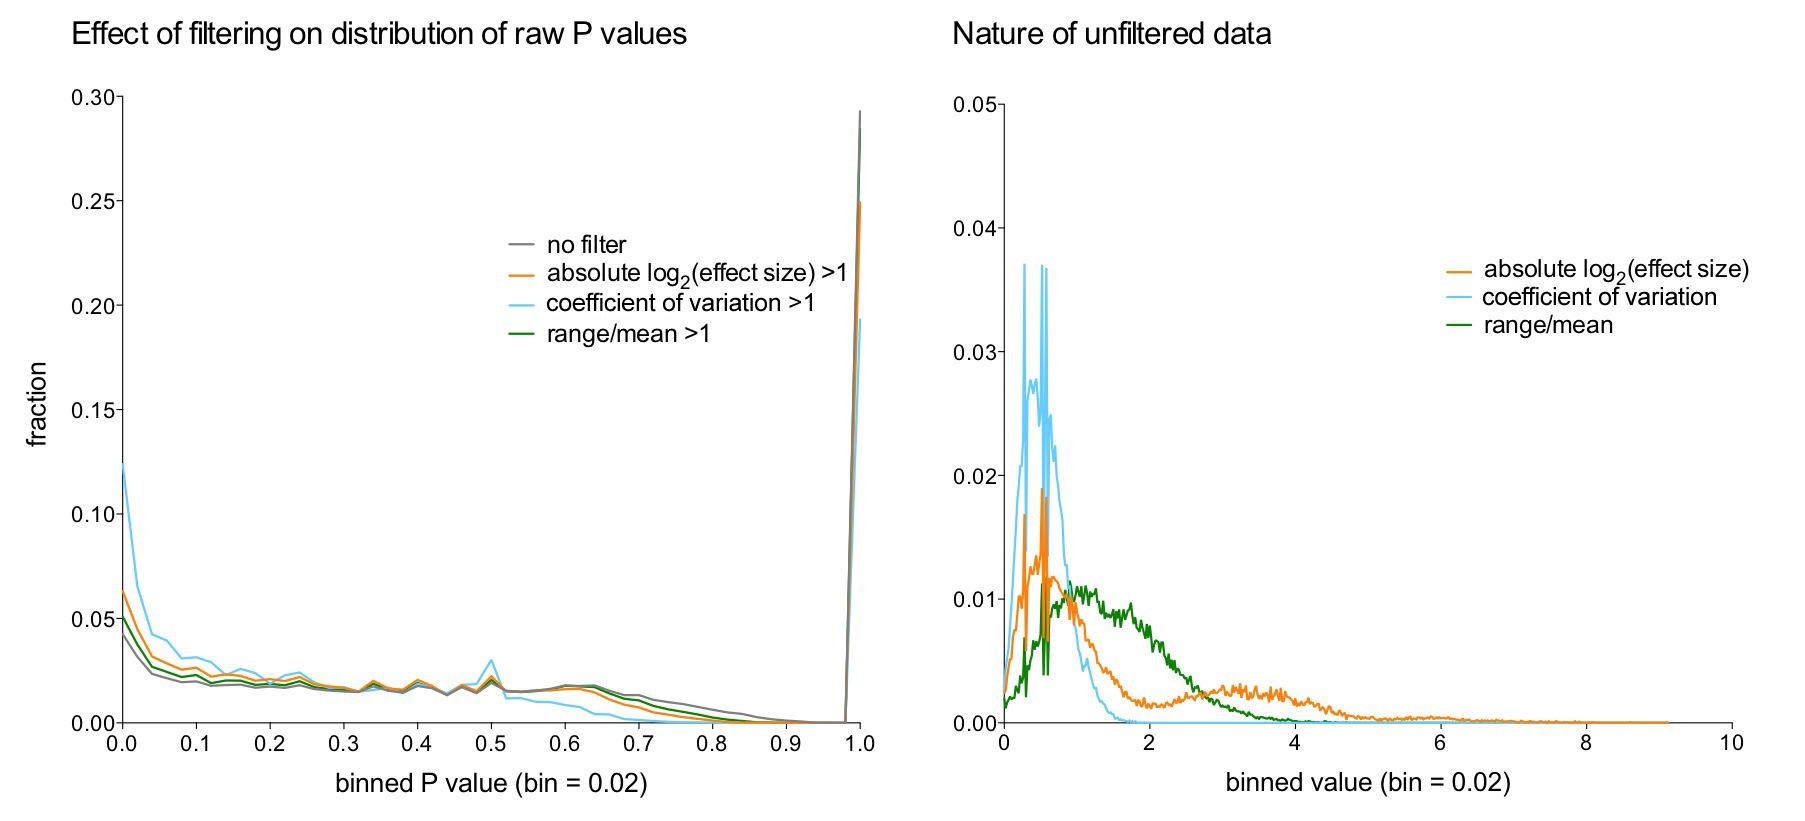
I examined the effect of different types of filtering on the raw P value distribution for a subset of the data (randomly picked a fifth of the variables). Though I am not going to use an effect size-based filtering, it seems that such filtering does not have a very major effect in the case of my data.

filter effects on P values

$\endgroup$

Your Answer

By clicking “Post Your Answer”, you agree to our terms of service and acknowledge you have read our privacy policy.

Not the answer you're looking for? Browse other questions tagged or ask your own question.