1
$\begingroup$

Why does doing Linear Discrimenant Analysis (LDA) on a outer product of input matrix gives same result as doing Principal Component Analysis (PCA) of the input matrix?

Not exactly sure where this came from and why it works, but the outer product of the input matrix $X^T X$

In PCA they use it to make the matrix square, so they can perform linear discrimant analysis on that matrix.

It's also used in Normal equation as the first step, for solving the regression coefficient in linear regression. A geometric interpretation would be very helpful.

$\endgroup$
3
  • $\begingroup$ Do you mean geometric interpretations like those offered in stats.stackexchange.com/questions/2691/…? $\endgroup$
    – whuber
    Commented Feb 22, 2014 at 3:24
  • $\begingroup$ Show an example here. What you are writing about seems to be a coincident. $\endgroup$
    – ttnphns
    Commented Feb 22, 2014 at 7:54
  • 1
    $\begingroup$ Your question is quite confusing and as stated does not make sense. What does "LDA on a outer product of input matrix" mean? Please clarify. $\endgroup$
    – amoeba
    Commented Feb 22, 2014 at 17:03

1 Answer 1

5
$\begingroup$

First of all, these are guesses what your question could be about, so please comment/update your question.

(You are not asking about kernel LDA, are you?)

(This is for data with cases in rows and variates in columns)

In a way the answer is: it doesn't, you probably overlooked two small points.

  • The centering of the input is different: PCA centers on the overall mean, LDA on the class means.
  • The projections differ by whether the eigenvalues end up in the scores (PCA) or in the loadings/coefficients (LDA)
    As this is just a squeezing of each individual axis, it is easy to overlook this difference in plots unless the axis scaling is fixed.

  • input vs. outer product: that is because of the connections between SVD on input and eigen decomposition of the outer product.

Here's the long explanation


PCA

First of all, the underlying big principle in PCA is a singular value decomposition $\mathbf X = \mathbf U \mathbf \Sigma \mathbf V^T$ in order to find the major axes of the variance-covariance ellipsoid.

Remember that $\mathrm{COV} (\mathbf X) = \frac{1}{n - 1} \mathbf X^T \mathbf X$ for mean centered $\mathbf X$ .

There are several equivalent ways of doing this. In particular, you can use the eigen decomposition of $\mathbf X^T \mathbf X = \mathbf V \mathbf \Lambda \mathbf V^T$ or of $\mathbf X \mathbf X^T = \mathbf U \mathbf \Lambda \mathbf U^T$. (The two $\mathbf \Lambda$s are diagonal matrices, their first $r$ diagonal elements are the same ($r$ = rank) and they are also the sqare of the diagonal elements of $\Sigma$ (also a diagonal matrix), the remaining elements are 0.)

Now PCA uses $\mathbf V$ for projection. This is a rotation that aligns the major axes of the variance-covariance ellipsoid with the new coordinate axes. The PC scores are then $\mathbf U \mathbf \Sigma$.

LDA

Recall that LDA maximises the between-class variance : within-class variance. While it is not immediately obvious which directions do this in general, this is easy in the special case where the within-class variance has a spherical structure (i.e. is proportional to the identity matrix). In that case, the directions between the class means maximise the between-class variance.

  • The difference between within-class variance-covariance matrix and the overall-variance covariancee matrix above is that the centering occurs within each class.

  • The $\mathbf U$ of the SVD above has the requested identity covariance structure. So for LDA, we go one step further in the projection compared to the CA and squeeze the new axes so that the variance-covariance matrix of the scores is the identity matrix.
    So all we need to do is to multiply $\mathbf \Sigma$ into the loadings (coefficients) instead of into the scores.

  • In that LDA score space, the directions between the class means are normal vectors for the decision planes. Of course we can project it back into the original space, where the directions are tilted according to the within-class variance-covariance structure.

Here's a picture:
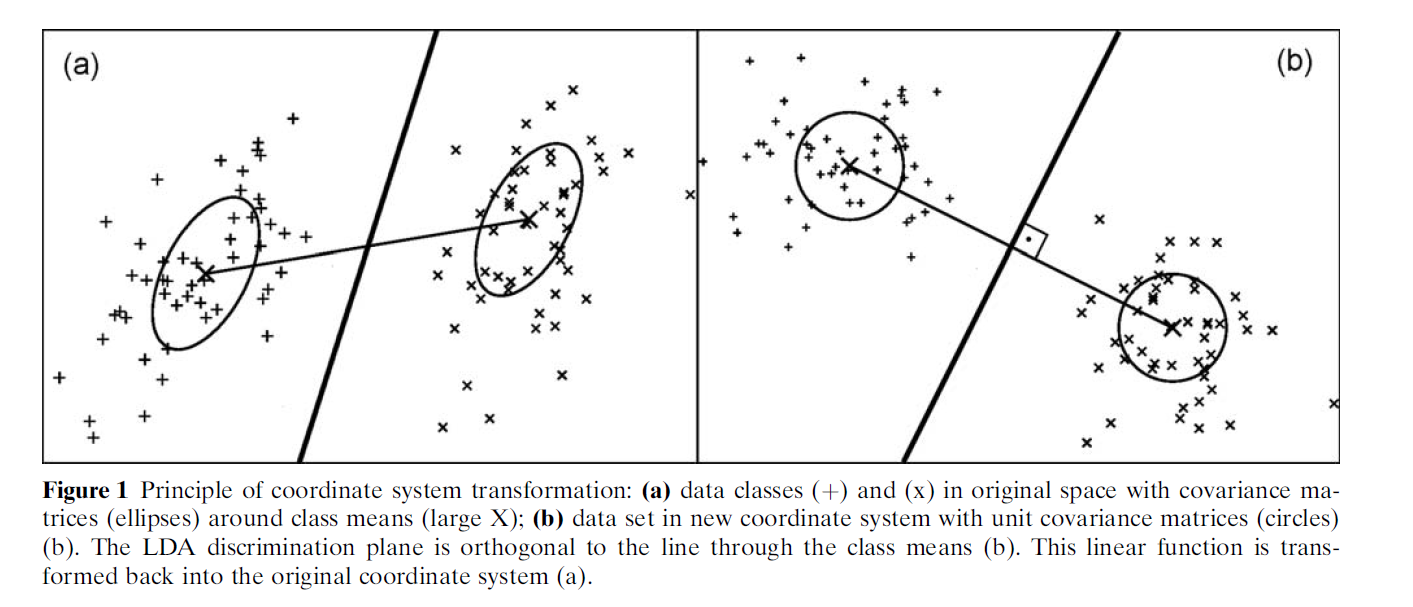
LDA explanation

Citation is: Krafft, C.; Steiner, G.; Beleites, C. & Salzer, R.: Disease recognition by infrared and Raman spectroscopy., Journal of Biophotonics, 2, 13-28 (2009). DOI: 10.1002/jbio.200810024

$\endgroup$
6
  • $\begingroup$ (+1) Maybe you could add somewhere in the PCA part that you assume that in $\mathbb{X}$ columns are variables/features and rows are observations/data-points (as often the convention is opposite). $\endgroup$
    – amoeba
    Commented Feb 22, 2014 at 16:56
  • $\begingroup$ @amoeba: I added the info. But can you point me to where the opposite convention is the default? So far, the closest I've met to that was when both Q- and R-mode analyses were considered (but the data convention was still cases in rows). $\endgroup$
    – cbeleites
    Commented Feb 22, 2014 at 17:00
  • $\begingroup$ Sorry, I got confused when I wrote my comment. The convention you used is indeed more common (at least in the textbooks I know and use). However, I definitely did see multiple machine learning papers using the opposite convention. I don't have any examples at hand, but I could search for some if you are really curious. $\endgroup$
    – amoeba
    Commented Feb 22, 2014 at 22:02
  • $\begingroup$ @amoeba: Ahh, now that you say that I remember seeing some algorithm descriptions that were "transposed" - I somehow had an idea that the caos stems rather from the different "coordinate systems" for matrices (down then right), cartesian (right then up) and images (right then down)... $\endgroup$
    – cbeleites
    Commented Feb 22, 2014 at 22:06
  • $\begingroup$ @cbeleites: The pic says LDA discrimination plane is orthogonal to the line through the class means. Sorry for asking. Does it mean that the discriminant (its axis) itself is that line connecting the 2 centres on the right? And on the left, this axis would remain, perpendicular to the "plane" (the thick line), so that it doesn't connect the 2 centres anymore? (See e.g. my pic here). $\endgroup$
    – ttnphns
    Commented Feb 23, 2014 at 18:39

Your Answer

By clicking “Post Your Answer”, you agree to our terms of service and acknowledge you have read our privacy policy.

Not the answer you're looking for? Browse other questions tagged or ask your own question.