3
$\begingroup$

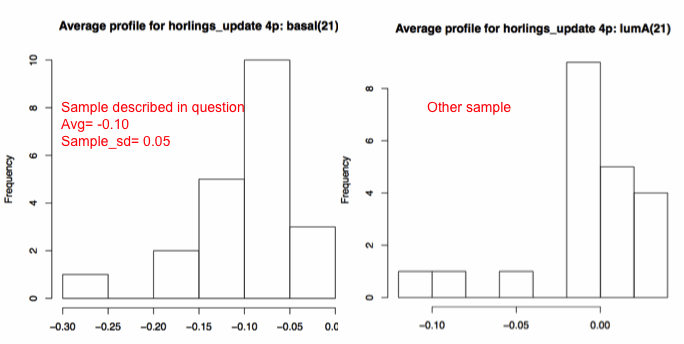
I want to test if my data have a mean equal to zero (Ho: mu=0). The sample size in not large (n=21). My variable is numerical with average -0.10 and sample_sd 0.05. I don't know the population variance. The only test I know to do this, is t-test. I checked for normality using Shapiro Wilks and it gets rejected (therefore no evidence of normality). I understand that t is relatively robust to moderate violations of the normality assumption; what is not clear to me is, how much is moderate? I do need to run other test like this for other samples. May someone be so kind to provide me with examples of how much can I deviate in skewness and kurtosis for sample sizes between 12 and 25? What else can I do to test against zero if I can't use t-test? Thank you in advance

enter image description here

$\endgroup$
2
  • $\begingroup$ Your plot does not match your description of the data: although it reflects 21 values, they clearly do not have the mean, max, or min you report. Moreover, it is impossible for a dataset of 21 numbers between -0.8 and 2 to have a SD of just 0.05. $\endgroup$
    – whuber
    Commented Mar 29, 2014 at 22:00
  • $\begingroup$ Very true. Sorry to be misleading. I added the one described in the question to the left. As I mentioned, I want to know how much is a moderate deviation from normality in the different samples I have. Hopefully with two images I can get even better feedback. $\endgroup$
    – Gina
    Commented Mar 30, 2014 at 0:24

2 Answers 2

1
$\begingroup$

What makes "mild deviations" mild depends on you and what you're doing. Deviations from normality (or indeed any other assumptions) will impact the significance level and the power of a one-sample t-test.

For example, a heavy tailed distribution will tend to have a true type I error rate that's lower than the one that you'd get if the data were normal with the same critical region, and somewhat lower power (higher type II error rate) partly because of that shift in type I error.

In some cases this kind of thing mightn't matter very much (I usually don't really care all that much if my type I error rate is 3% instead of 5%, as long as I have some sense of the size and direction of the impact). In other cases it might be more important.

It's possible to use simulation to make some assessment of how badly those things might be affected for various kinds and sizes of non-normality, so you can decide then whether you're prepared to deal with that.

In large samples, the normality assumption tends to become less critical (though the other assumptions - like independence - tend to remain relatively important).

If you know a good approximation to the distributional shape, sometimes another parametric assumption can be made (for example, if the distribution for this kind of data tends to be somewhat right skew, one might be able to approximate it reasonably well with a gamma distribution and use a GLM to do the test).

Some people use transformations, but there are two problems: (i) with small samples, you can't reasonably assess whether the transformation does sufficiently improve the distribution of the test statistic; and (ii) you're no longer testing for a shift in mean of the original distribution (if you're not focused on means, that may not matter, and with some additional assumptions, you may still be able to make a suitable conclusion about means). Similar comments apply to rank-based tests; if you don't care explicitly about mean-shift alternatives or you're prepared to make some additional assumptions, the fact that they're not directly testing for mean-shifts may not matter to you.

One solution if you really don't have a pretty solid idea of what the shape might be but really do want to be testing for a shift in mean is to look at a permutation test.
$\endgroup$
3
  • $\begingroup$ I've done permutation tests to compare two samples assigning random labels. How does it work with only one sample? If you have a link to read about it will be of great help. Another question, is there a number in skewness (for instance less than 1) where I could say is symmetric enough? is there a number for kurtosis to say is close enough to 0 (normal kurtosis)? $\endgroup$
    – Gina
    Commented Mar 29, 2014 at 1:46
  • $\begingroup$ As my answer already suggests, what is 'close enough' for your purposes depends on your purposes and your tolerance for effects on significance and power. I can't tell you where to draw those lines and I expect my own ideas of 'close enough' for my applications would seem strange choices for yourself and your applications. For a one sample permutation test of location, if you are prepared to assume symmetry about $\mu_0$ under the null, then you can subtract $\mu_0$ from each observation and write each deviation observation as the magnitude (absolute value) x its sign, &then permute the signs. $\endgroup$
    – Glen_b
    Commented Mar 29, 2014 at 5:57
  • $\begingroup$ Aside from my previous suggestions, there's also the possibility of a one sample test based off a bootstrap confidence interval (which doesn't assume symmetry). However, the bootstrap tends to work better with larger samples than this. $\endgroup$
    – Glen_b
    Commented Mar 29, 2014 at 6:02
0
$\begingroup$

You could provide a plot of the data so we are able to comment on the violation of normality. On the other hand, you could perform a permutation t-test to test the mean. This would not assume any distribution.

$\endgroup$
1
  • $\begingroup$ I just uploaded a couple of histograms. The one described in the question and another one more skewed. $\endgroup$
    – Gina
    Commented Mar 30, 2014 at 0:47

Your Answer

By clicking “Post Your Answer”, you agree to our terms of service and acknowledge you have read our privacy policy.

Not the answer you're looking for? Browse other questions tagged or ask your own question.