37
$\begingroup$

I am planning my wedding. I wish to estimate how many people will come to my wedding. I have created a list of people and the chance that they will attend in percentage. For example

Dad 100% Mom 100% Bob 50% Marc 10% Jacob 25% Joseph 30%

I have a list of about 230 people with percentages. How can I estimate how many people will attend my wedding? Can I simply add up the percentages and divide it by 100? For example, if I invite 10 people with each a 10% chance of coming, I can expect 1 person? If I invite 20 people with a 50% chance of coming, can I expect 10 people?

UPDATE: 140 people came to my wedding :). Using the techniques described below I predicted about 150. Not too shabby!

$\endgroup$
7
  • 43
    $\begingroup$ I see no figure for the person you are marrying. That is the most important quantity. $\endgroup$
    – Nick Cox
    Commented Apr 13, 2014 at 12:02
  • 6
    $\begingroup$ I used your technique for my wedding and it worked well; we predicted about 80 people and got 85 or so. I note that once you have all those people in your spreadsheet you can also use the same spreadsheet to track things like who you've sent thank-you notes to, and so on. $\endgroup$ Commented Apr 13, 2014 at 15:47
  • 2
    $\begingroup$ Relevant: timharford.com/2013/10/guest-list-angst-a-statistical-approach. For what it's worth, I've chosen the link to the author's personal blog but the article is from his column in the Financial Times. $\endgroup$ Commented Apr 14, 2014 at 9:32
  • $\begingroup$ @EricLippert I tried something similar for my wedding but didn't have as good of success. There was a very severe thunderstorm the day of and everyone < 30%ish with an hour commute or more didn't show. $\endgroup$
    – OSE
    Commented Apr 14, 2014 at 13:46
  • 3
    $\begingroup$ @NickCox Also they forgot their own. $\endgroup$
    – jfa
    Commented Apr 14, 2014 at 17:47

8 Answers 8

32
$\begingroup$

Assuming that the decisions of invited persons to come to the wedding are independent, the number of guests that will come to the wedding can be modeled as the sum of Bernoulli random variables that have not necessarily identical probabilities of success. This corresponds to the Poisson binomial distribution.

Let $X$ be a random variable corresponding to the total number of persons that will come to your wedding out of $N$ invited persons. The expected number of participants is indeed the sum of individual ''show-up'' probabilities $p_i$, that is $$ E(X) = \sum_{i = 1}^N p_i . $$ The derivation of confidence intervals isn't straightforward given the form of the probability mass function. However, they are easy to approximate with Monte Carlo simulations.

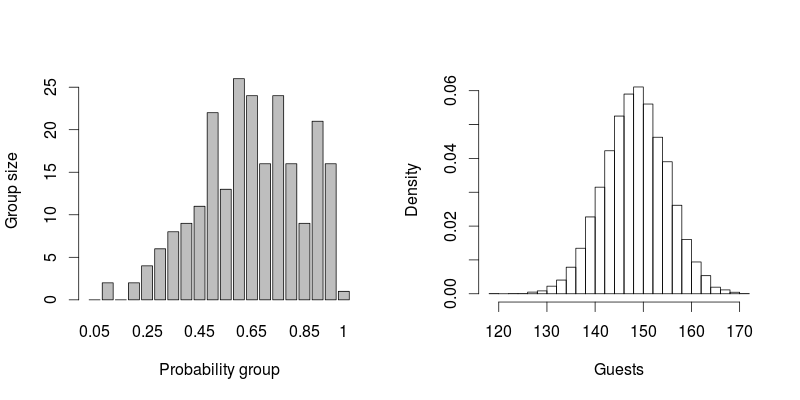
The following figure shows an example of the distribution of the number of participants to the wedding based on 10000 simulated scenarios (right) using some fake show-up probabilities for the 230 invited persons (left). The R code used to run this simulation is shown below; it provides approximations of confidence intervals.

enter image description here

## Parameters
N      <- 230    # Number of potential guests
nb.sim <- 10000  # Number of simulations

## Create example of groups of guests with same show-up probability
set.seed(345)
tmp    <- hist(rbeta(N, 3, 2), breaks = seq(0, 1, length.out = 21))
p      <- tmp$breaks[-1]    # Group show-up probabilities
n      <- tmp$counts        # Number of person per group

## Generate number of guests by group
guest.mat <- matrix(NA, nrow = nb.sim, ncol = length(p))
for (j in 1:length(p)) {
    guest.mat[, j] <- rbinom(nb.sim, n[j], p[j])
}

## Number of guest per scenario
nb.guests <- apply(guest.mat, 1, sum)

## Result summary
par(mfrow = c(1, 2))
barplot(n, names.arg = p, xlab = "Probability group", ylab = "Group size")
hist(nb.guests, breaks = 21, probability =  TRUE, main = "", xlab = "Guests")
par(mfrow = c(1, 1))

## Theoretical mean and variance
c(sum(n * p), sum(n * p * (1-p)))
#[1] 148.8500  43.8475

## Sample mean and variance
c(mean(nb.guests), var(nb.guests))
#[1] 148.86270  43.23657

## Sample quantiles
quantile(nb.guests, probs = c(0.01, 0.05, 0.5, 0.95, 0.99))
#1%     5%    50%    95%    99% 
#133.99 138.00 149.00 160.00 164.00 
$\endgroup$
4
  • 1
    $\begingroup$ Wow this is fantastic. What kind of simulation is this exactly? $\endgroup$
    – Behacad
    Commented Apr 15, 2014 at 6:51
  • 4
    $\begingroup$ It is a Monte Carlo simulation $\endgroup$
    – QuantIbex
    Commented Apr 15, 2014 at 7:26
  • $\begingroup$ How do you transform "group size" into number of guests? I have a figure such as yours on the left, but am unsure how to turn it into the figure on the right... $\endgroup$
    – Behacad
    Commented Apr 15, 2014 at 8:03
  • $\begingroup$ This is done in lines 11 to 18 of the code provided in the answer. For scenario j, I generate the number of "show-ups" for each of the 20 probability group using a binomial distribution and the probability to show up of that group. $\endgroup$
    – QuantIbex
    Commented Apr 15, 2014 at 8:08
18
$\begingroup$

As has been pointed out, the expectations simply add.

However, knowing the expectation isn't much use, you also need some sense of the likely variation around it.

There are three things you need to be concerned about:

  • variation in the individuals around their expectation (a person with 60% chance of coming doesn't actually achieve their expectation; they're always either above or below it)

  • dependence between people. Couples that might both come will tend to either both attend or neither. Young children won't attend without their parents. In some cases, some people may avoid coming if they know another person will be there.

  • error in estimation of the probabilities. Those probabilities are just guesses; you might want to consider the effect of somewhat different guesses (maybe someone else's assessments of those numbers)

The first is amenable to calculation, either by normal approximation or via simulation. The second might be simulated under various assumptions, either specific to the people, or by considering some distribution of dependencies. (The third item is more difficult.)


Edited to address followup questions in comments:

If I understand your phrasing correctly, for the family of 4, you have a 50% chance each of either 4 people or none coming. That's an expected number of 2, certainly, but you'd want to have some idea of the variability around the expectation as well, in which case you probably want to keep the actual situation of 50% of 0/50% of 4.

If you can partition everyone into independent groups, a good first approximation (with lots of such groups) would be then to add the means and variances across independent groups and then treat the sum as normal (perhaps with continuity correction). More accurate approach would be to simulate the process or to compute the distribution exactly via numerical convolution; while both approaches are straightforward, this is an unnecessary level of precision for this particular application, since there's so many layers of approximation already - it's like being told the dimensions of a room to the nearest foot and then calculating how much paint you'll need to the nearest milliliter - the additional precision is pointless.

So imagine (for simplicity) we had four groups:

1) group A (1 individual) - 70% chance of attendance

2) group B (1 individual) - 60% chance of attendance

3) group C (family of 4) - 0: 0.5 4: 0.5 (if anyone stays home, none will come)

4) group D (couple of 2) - 0: 0.4 1: 0.1 2: 0.5 (i.e. 50% chance of both, plus 10% chance exactly one will come, e.g. if the other has work commitments or is ill)

Then we get the following means and variances:

      mean   variance
  A    0.7     0.21
  B    0.6     0.24
  C    2.0     4.0
  D    1.1     0.89

 Tot   4.4     5.34

So a normal approximation will be pretty rough in this case, but would suggest that more than 7 people would be pretty unlikely (on the order of 5%), and 6 or less would occur roughly 75-80% of the time.

[A more accurate approach would be to simulate the process, but on the full problem rather than the cut down example this is probably unnecessary since there's so many layers of approximation already.]


Once you have your combined distribution that incorporates such group-dependencies, you might then wish to apply any sources of overall joint dependency (such as severe weather) -- or you may wish to simply insure against or even ignore such eventualities, depending on circumstances.

$\endgroup$
14
  • 5
    $\begingroup$ +1 for mentioning dependencies. These arise for reasons other than interpersonal relationships, such as weather and travel conditions. Many of them induce positive correlations--which widen the range of uncertainty. If the estimates will be used to provide logistics (meals, seats, and so on), assessing the variation accurately is valuable. Although in a wedding application one can't do much more than make an educated guess, having a qualitative understanding of these statistical phenomena can lead to better guesses. $\endgroup$
    – whuber
    Commented Apr 13, 2014 at 15:29
  • $\begingroup$ @whuber Good point about other sources of dependence, such as weather. In some circumstances, such things can easily swamp the effects I mention. $\endgroup$
    – Glen_b
    Commented Apr 13, 2014 at 15:36
  • $\begingroup$ How could I easily take into account dependency? For example, if I know of a couple with two children, and I expect that the parents have about a 50% chance of coming. I know they will bring their children if they come. Is it save to attribute 50% to each person, and basically assume that 2 people are coming? $\endgroup$
    – Behacad
    Commented Apr 13, 2014 at 23:56
  • 2
    $\begingroup$ @Behacad: If you know it's a question of all-or-none with a given group, you could just estimate the probability of the group coming as a single unit and weight the group by the number of individuals in it. I agree that margins of error would be good to include in your estimates too. $\endgroup$ Commented Apr 14, 2014 at 0:18
  • $\begingroup$ Thank you. I have a small table with percentages and amount of people with that percentage, but I don't know exactly what to do now. What means should I be adding? What variances? (100%-52, 90%-21, 80%-34, 70%-16,60%-32,50%-35,40%-25,30%-11,20%-22,10%-15,0%-9) $\endgroup$
    – Behacad
    Commented Apr 14, 2014 at 3:48
5
$\begingroup$

(Ignore my earlier comment on this - I just realised I was confusing the expectation with something else.) Given that you're essentially trying to find the expectation of the number of people showing up, you can theoretically add the probability of each person showing up to do so.

This is because we can consider someone showing up as taking either the value $0$ or $1$, and because the expectation is a linear operator.

However, this only gives you the expected value - without further assumptions it would seem difficult to estimate things like variance of people showing up, particularly since it's pretty fair to assume that person A showing up is not necessarily independent of person B showing up.

That aside, here's a vaguely relevant BBC article.

$\endgroup$
4
  • $\begingroup$ Thank you! So just to confirm, if I think 10 people have a 10% chance of coming, I can guess that 1 person will come, for example. $\endgroup$
    – Behacad
    Commented Apr 13, 2014 at 5:40
  • $\begingroup$ In theory yes, but it seems difficult to construct anything more useful (e.g. confidence intervals) without any further assumptions on things. $\endgroup$
    – user38457
    Commented Apr 13, 2014 at 5:44
  • $\begingroup$ Thank you. How could I arrive at confidence intervals? $\endgroup$
    – Behacad
    Commented Apr 13, 2014 at 5:45
  • $\begingroup$ That I'm not completely sure for a number of reasons. (I'd probably have to spend more time looking up some things to give any more of a detailed answer on that.) $\endgroup$
    – user38457
    Commented Apr 13, 2014 at 5:47
4
$\begingroup$

For large numbers, 80% is what you'd expect. This may be a situation where a detailed analysis as you propose only adds errors to the calculations.
For example, is Marc's potential attendance really 1/3 of Joseph's? And is Joseph's really 30%, or might it be 25%? Things happen when you reach large numbers that simply make 80% more valid than all this analysis. I just came back from a wedding. 550 invited. 452 attended. For purposes of planning the hall and starting to talk to the caterer, the initial estimate of 440 was fine.

May I offer a line from my toast to the couple? "Remember, if your wife is happy, but you are not happy, you are still far happier than if your wife is unhappy, but you are happy."

$\endgroup$
4
  • $\begingroup$ Thank you! One concern is that people will be coming from all over and from varying distances. Some quite far, others just down the street. $\endgroup$
    – Behacad
    Commented Apr 14, 2014 at 4:20
  • 3
    $\begingroup$ This figure might be culture-dependent. $\endgroup$ Commented Apr 14, 2014 at 13:52
  • $\begingroup$ @Juho - that may be. I am in the US and in my recent example, it was a destination wedding for about half the invitees, i.e. wedding was in bride's hometown. I wonder what cultural differences would impact turnout, but I suspect you are right. $\endgroup$ Commented Apr 14, 2014 at 14:38
  • 4
    $\begingroup$ This is a wonderful example of an estimator that exists in theory but seems unusual in practice (until you look for this sort of thing): given any set of data, it returns a predetermined number (80% in this case). It is easy to compute, very inexpensive (data collection costs can be reduced to zero) and has zero variance. It is Bayes (for an atomic prior) and admissible. There will still be nagging questions about its bias and consistency that can be difficult to address and won't go away by avoiding a "detailed analysis." $\endgroup$
    – whuber
    Commented Apr 15, 2014 at 20:18
2
$\begingroup$

As a statistician who just got married, I'll tell you that JoeTaxpayer has the right answer. The 80% figure strikes me as a little high, though could be accurate if most of the people are local (ours was a destination wedding and we landed closer to 65%).

But nonetheless, you're assuming a lot of variability in the prior probabilities that people attend, I think more than really exists. Assuming you don't invite people who actively dislike you, you should assume that just about everybody will come for whom it is within their means and they don't have a conflict (in a broad sense), but at least 10-20% WILL have something that keeps them from attending. For those who have to travel, that increases the time and money required so figure 30-35% of travelers won't attend (depending on distance). Otherwise, keep the probabilities constant (even if your parents say "oh so-and-so won't fly all the way to Austin, we just want to invite them..."). If you're having a fun reception, especially with an open bar, people generally won't skip that unless they have to.

Anyway, congratulations on getting married. Now as to the probability that you stay married, this is always a good read: http://users.nber.org/~bstevens/papers/Marital_Stability.pdf

:-)

$\endgroup$
1
$\begingroup$

Add up all probabilities, that's your expected number of people to come.

You have i=1..N events, each has probability $P_i$. The expected number of people to come is $\sum_i1_iP_i$, where $1_i$ - indicator variable equal to one if a person shows up, and zero otherwise.

Of course, we're assuming that whether someone comes or not does not depend on other people's attendance. This assumption is simply wrong. Consider couples, they're highly correlated.

Since you do not have data on correlations, the best you can do is to handle couples as a unit, i.e. $2\times1_iP_i$, where $P_i$ is the probability the couple will show up.

$\endgroup$
1
$\begingroup$

For my wedding, I made two lists -- likely to attend (80%) and unlikely to attend (20%). Regardless of any more refined assessment for any reason, I assigned everyone invited to one of the two groups. I was off by 2 people. N = 1. Purely heuristic.

$\endgroup$
2
  • $\begingroup$ May I ask? What was the final % turnout? $\endgroup$ Commented Apr 17, 2014 at 9:58
  • $\begingroup$ 72% responded yes, but I forget how many day-of cancellations. $\endgroup$ Commented Apr 18, 2014 at 13:27
0
$\begingroup$

I notice that no one has pointed out that you do not need to divide by 100. Your percentages can be viewed as expected portions of a person to show up, with the understanding that, like Schrödinger's cat, you will not get parts of a person in attendance or not in attendance, but the attendance state of each person will be entirely resolved at the moment of the event.

Since the range of your percentages run from 0% (none of the person showing up) to 100% (all of the person showing up), in your two examples involving 10 and 20 people, you summed the expected value for the portion of each person to show up, and got a number whose units were "people".

The prominent equation in QuantIbex's superb answer shows that summing the percentages results in the expected number of people at the event, no division involved.

$\endgroup$

Not the answer you're looking for? Browse other questions tagged or ask your own question.