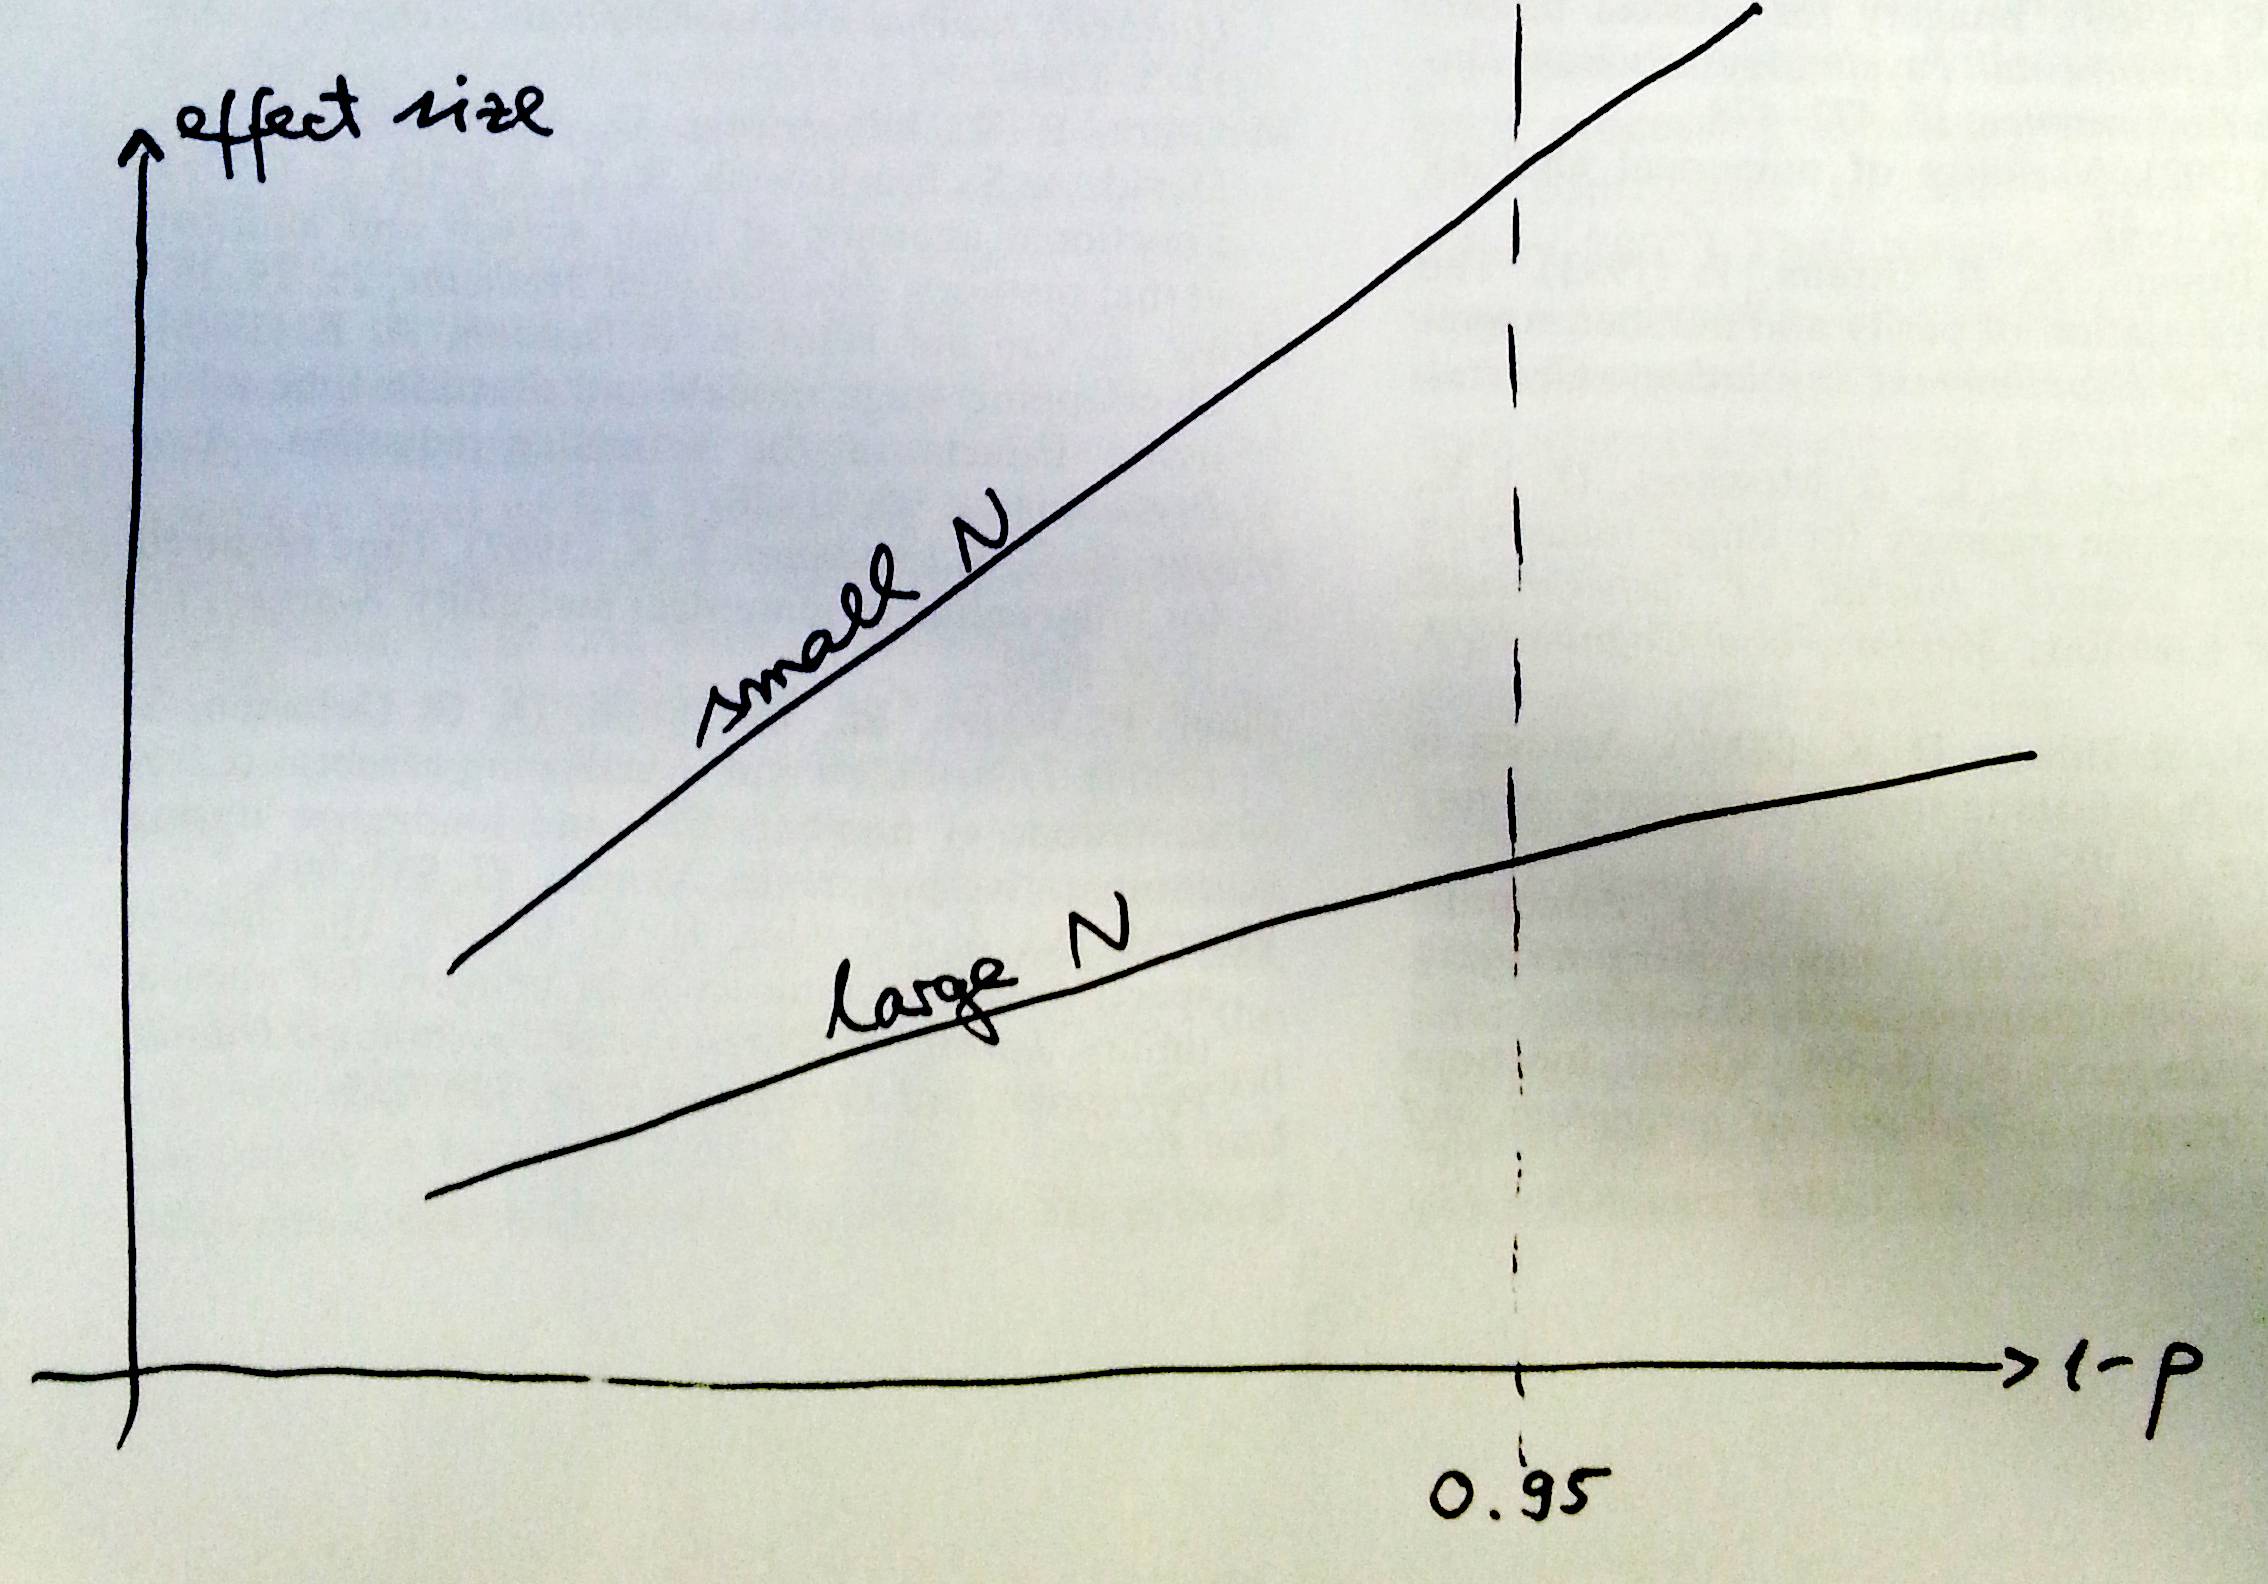
As an example, look at the relationship between t, p and d in the t-test.
p is defined as the probability of obtaining a test statistic this or more extreme, if the hypothesis under test is true. It is inversely related to both the sample size and the test statistic - in this case, t. Conversely, t ~ 1-p and n ~ 1-p.
For correlated samples,
$d_{z} = \frac{t}{\sqrt{n}}$. Then, $d_{z}\sqrt{n} = t$; then, if n is held constant, as $d_{z}$ increases, t increases; and since t ~ 1-p, $d_{z}$ ~ 1-p. Also, if $d_{z}$ is held constant, as n increases, t increases, and n ~ 1-p.
Colloquially speaking, since both 1-p and the measures of effect size depend on how extreme the test statistic is, they are correlated.
This will apply to other measures of effect size as well, such as the relationship between F, n and $\eta^2$ - trivially for those cases where the F-test converges with the t-test; or for correlation coefficients, which can also converge with the t-test.
(I'd be very interested to learn if there are any measures of effect size which do not behave in this way, and by which justification they could be associated with other standardised measures of effect size.)
in order to reach significance you need to be trying to prove an effect that is large enough
Note that an effect size (such as r) is a descriptive statistic, a property of the sample. It is not inferential. To support a claim about the population, confidence intervals over effect sizes can be used.

