I tried clustering a set of data (a set of marks) and got 2 clusters. I would like to graphically represent it. Bit confused about the representation, since I don't have the (x,y) coordinates.
Also looking for MATLAB/Python function for doing so.
EDIT
I think posting data make the question clearer. I have two clusters I made using kmeans clustering in Python (not using scipy). They are
class 1: a=[3222403552.0, 3222493472.0, 3222491808.0, 3222489152.0, 3222413632.0,
3222394528.0, 3222414976.0, 3222522768.0, 3222403552.0, 3222498896.0, 3222541408.0,
3222403552.0, 3222402816.0, 3222588192.0, 3222403552.0, 3222410272.0, 3222394560.0,
3222402704.0, 3222298192.0, 3222409264.0, 3222414688.0, 3222522512.0, 3222404096.0,
3222486720.0, 3222403968.0, 3222486368.0, 3222376320.0, 3222522896.0, 3222403552.0,
3222374480.0, 3222491648.0, 3222543024.0, 3222376848.0, 3222403552.0, 3222591616.0,
3222376944.0, 3222325568.0, 3222488864.0, 3222548416.0, 3222424176.0, 3222415024.0,
3222403552.0, 3222407504.0, 3222489584.0, 3222407872.0, 3222402736.0, 3222402032.0,
3222410208.0, 3222414816.0, 3222523024.0, 3222552656.0, 3222487168.0, 3222403728.0,
3222319440.0, 3222375840.0, 3222325136.0, 3222311568.0, 3222491984.0, 3222542032.0,
3222539984.0, 3222522256.0, 3222588336.0, 3222316784.0, 3222488304.0, 3222351360.0,
3222545536.0, 3222323728.0, 3222413824.0, 3222415120.0, 3222403552.0, 3222514624.0,
3222408000.0, 3222413856.0, 3222408640.0, 3222377072.0, 3222324304.0, 3222524016.0,
3222324000.0, 3222489808.0, 3222403552.0, 3223571920.0, 3222522384.0, 3222319712.0,
3222374512.0, 3222375456.0, 3222489968.0, 3222492752.0, 3222413920.0, 3222394448.0,
3222403552.0, 3222403552.0, 3222540576.0, 3222407408.0, 3222415072.0, 3222388272.0,
3222549264.0, 3222325280.0, 3222548208.0, 3222298608.0, 3222413760.0, 3222409408.0,
3222542528.0, 3222473296.0, 3222428384.0, 3222413696.0, 3222486224.0, 3222361280.0,
3222522640.0, 3222492080.0, 3222472144.0, 3222376560.0, 3222378736.0, 3222364544.0,
3222407776.0, 3222359872.0, 3222492928.0, 3222440496.0, 3222499408.0, 3222450272.0,
3222351904.0, 3222352480.0, 3222413952.0, 3222556416.0, 3222410304.0, 3222399984.0,
3222494736.0, 3222388288.0, 3222403552.0, 3222323824.0, 3222523616.0, 3222394656.0,
3222404672.0, 3222405984.0, 3222490432.0, 3222407296.0, 3222394720.0, 3222596624.0,
3222597520.0, 3222598048.0, 3222403552.0, 3222403552.0, 3222403552.0, 3222324448.0,
3222408976.0, 3222448160.0, 3222366320.0, 3222489344.0, 3222403552.0, 3222494480.0,
3222382032.0, 3222450432.0, 3222352000.0, 3222352528.0, 3222414032.0, 3222728448.0,
3222299456.0, 3222400016.0, 3222495056.0, 3222388848.0, 3222403552.0, 3222487568.0,
3222523744.0, 3222394624.0, 3222408112.0, 3222406496.0, 3222405616.0, 3222592160.0,
3222549360.0, 3222438560.0, 3222597024.0, 3222597616.0, 3222598128.0, 3222403552.0,
3222403552.0, 3222403552.0, 3222499056.0, 3222408512.0, 3222402064.0, 3222368992.0,
3222511376.0, 3222414624.0, 3222554816.0, 3222494608.0, 3222449792.0, 3222351952.0,
3222352272.0, 3222394736.0, 3222311856.0, 3222414288.0, 3222402448.0, 3222401056.0,
3222413568.0, 3222298848.0, 3222297184.0, 3222488000.0, 3222490528.0, 3222394688.0,
3222408224.0, 3222406672.0, 3222404896.0, 3222443120.0, 3222403552.0, 3222596400.0,
3222597120.0, 3222597712.0, 3222400896.0, 3222403552.0, 3222403552.0, 3222403552.0,
3222299200.0, 3222321296.0, 3222364176.0, 3222602208.0, 3222513040.0, 3222414656.0,
3222564864.0, 3222407904.0, 3222449984.0, 3222352096.0, 3222352432.0, 3222452832.0,
3222368560.0, 3222414368.0, 3222399376.0, 3222298352.0, 3222573152.0, 3222438080.0,
3222409168.0, 3222523488.0, 3222394592.0, 3222405136.0, 3222490624.0, 3222406928.0,
3222407104.0, 3222442464.0, 3222403552.0, 3222596512.0, 3222597216.0, 3222597968.0,
3222438208.0, 3222403552.0, 3222403552.0, 3222403552.0]

class 2: b=[3498543128.0, 3498542920.0, 3498543252.0, 3498543752.0, 3498544872.0,
3498544528.0, 3498543024.0, 3498542548.0, 3498542232.0]
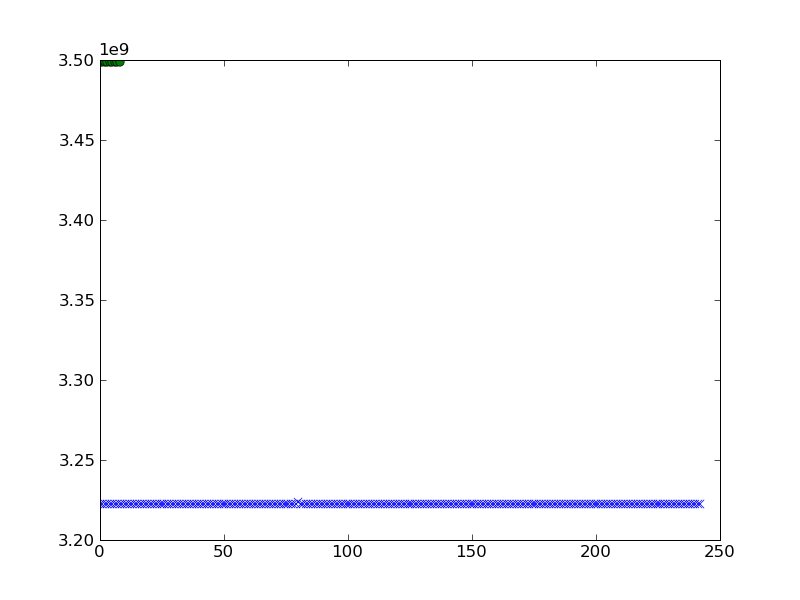
I would like to plot it. I tried the following and got the following result when I plot a and b.
pylab.plot(a,'x')
pylab.plot(b,'o')
pylab.show()

can I get a better visualization of clustering?


