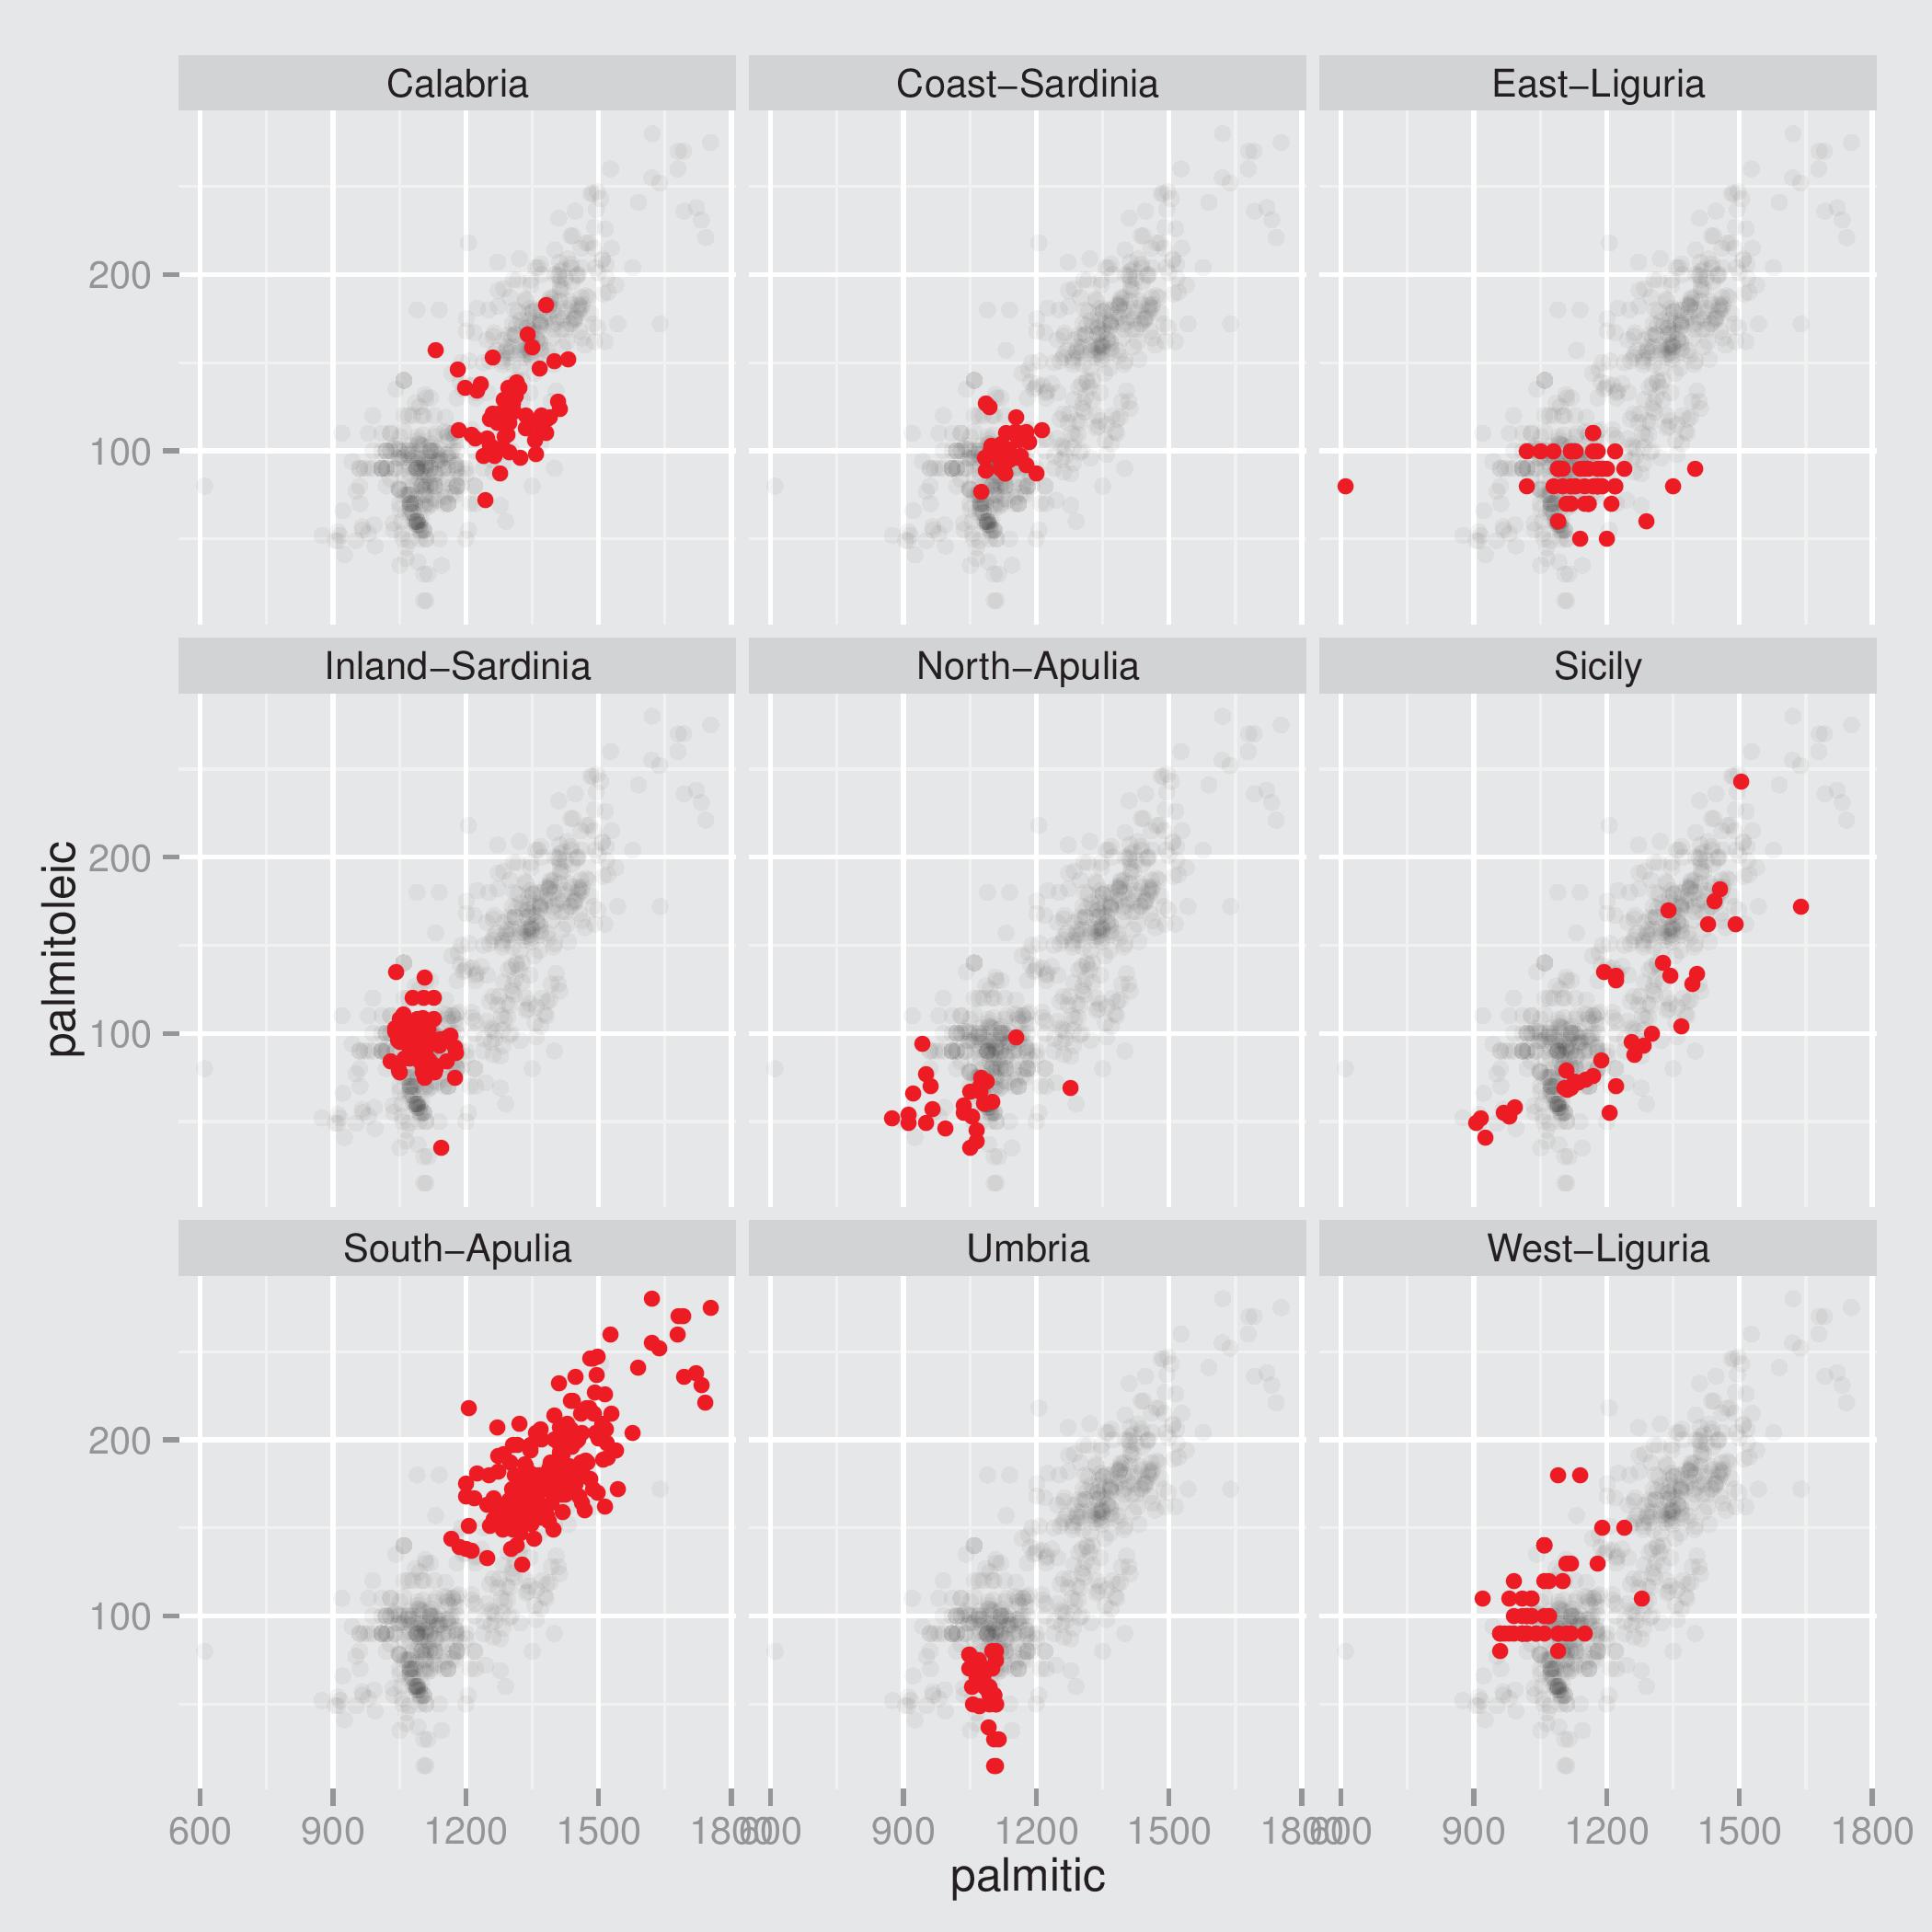
For those wanting to use a ggplot2 approach in R consider the facetshade function in the package extracat. This offers a general approach, not just for line plots. Here is an example with scatterplots (from the foot of this page):
data(olives, package="extracat")
library(scales)
fs1 <- facetshade(data = olives,
                  aes(x = palmitic, y = palmitoleic), f = .~Area)
fs1 + geom_point(colour = alpha("black", 0.05)) +
      geom_point(data = olives, colour = "red") +
      facet_wrap(f=~Area, nrow=3) + theme(legend.position="none")
EDIT: Using Adrian's simulated dataset from his earlier answer:
library(extracat)
facetshade(df, aes(x=time, y=y), f = .~label, bg.all = FALSE, keep.orig = TRUE) +
           geom_line(aes(x=time, y=y, group=orig.label),colour = alpha(1,0.3)) +
           geom_line(data=df, aes(colour=label), size = 1.2) + xlab("") + ylab("")
Another approach is to draw two separate layers, one for the background and one for the highlighted cases. The trick is to draw the background layer using the dataset without the faceting variable. For the olive oil dataset the code is:
data(olives, package="extracat")
ggplot(olives, aes(palmitic, palmitoleic)) +
  facet_wrap(~Area, nrow=3) +
  geom_point(data=olives %>% select(-Area), colour=alpha("black", 0.05)) +
  geom_point(data=olives, colour="red") +
  theme(legend.position="none")

