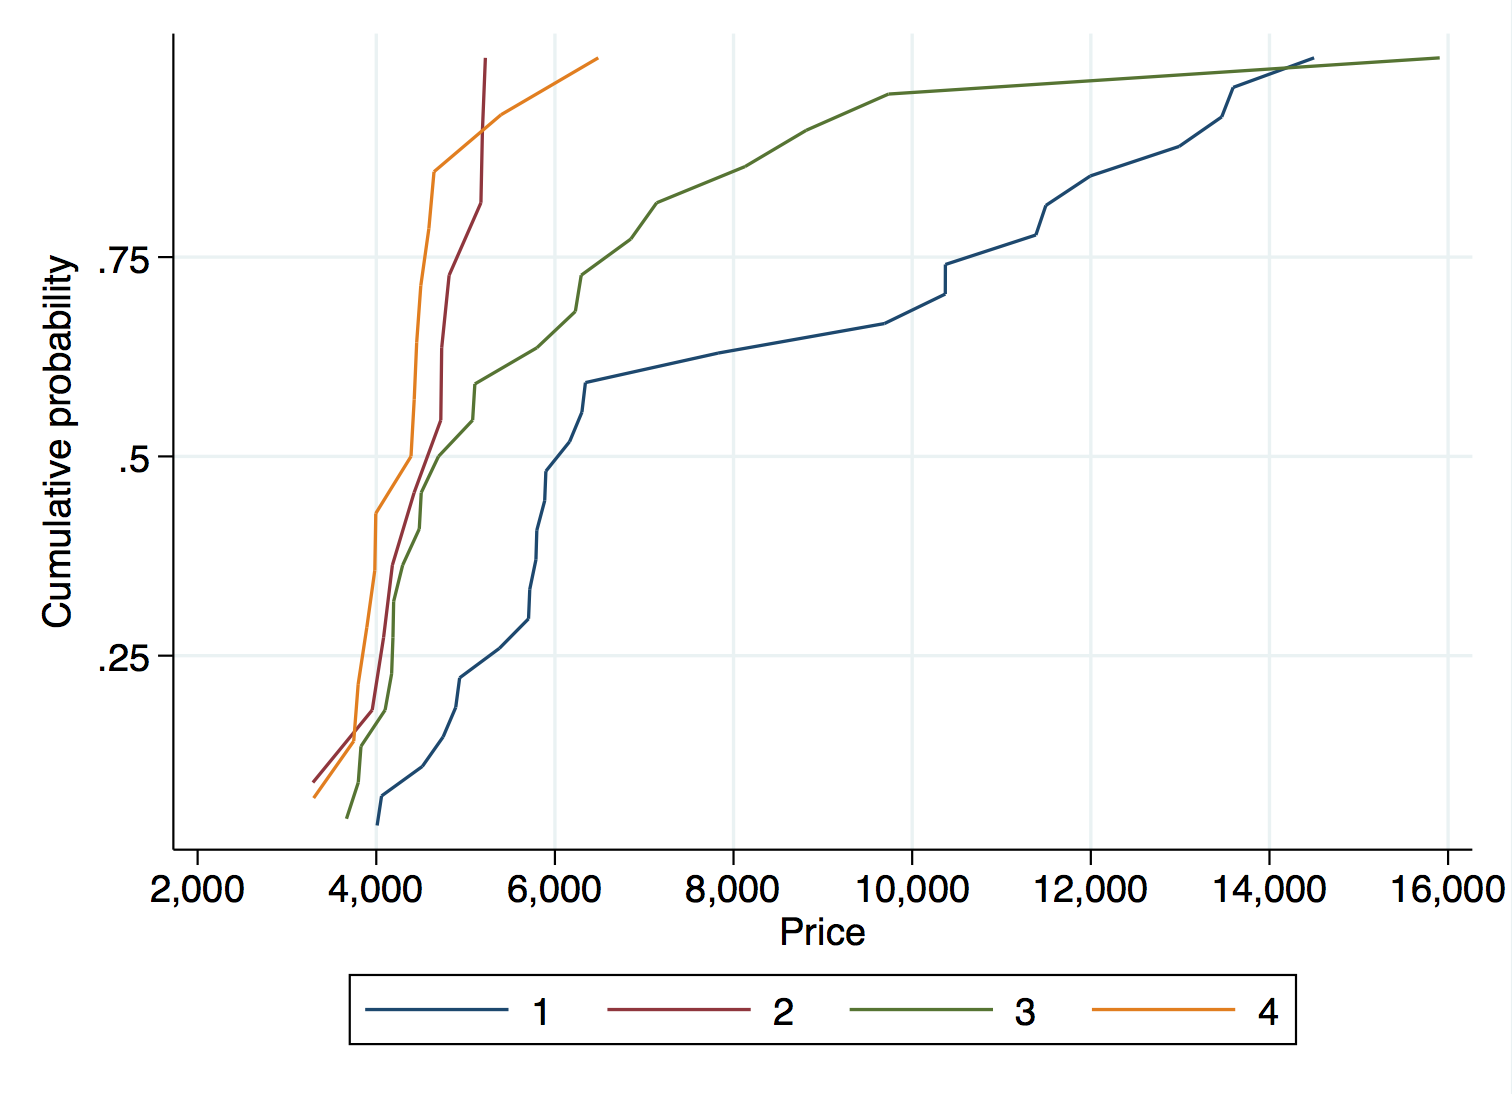
You can do something like this with simultaneous-quantile regression with a set dummies corresponding to the 4 groups. This allows you to test and construct confidence intervals comparing coefficients describing different quantiles that you care about.
Here's a toy example where we cannot reject the joint null that the 25th, 50th, and 75th quartile of car prices are all equal in all 4 MPG groups (the p-value is 0.374):
. sysuse auto, clear
(1978 Automobile Data)

. xtile mpg_quartile = mpg, nq(4)

. distplot price, over(mpg_quartile) legend(rows(1)) ylab(.25 .5 .75, angle(0) grid) xlab(#10, grid) ///
> plotregion(fcolor(white) lcolor(white)) graphregion(fcolor(white) lcolor(white))

.
. sqreg price i.mpg_quart, quantile(.25 .5 .75) reps(500)
(fitting base model)

Bootstrap replications (500)
----+--- 1 ---+--- 2 ---+--- 3 ---+--- 4 ---+--- 5
..................................................    50
..................................................   100
..................................................   150
..................................................   200
..................................................   250
..................................................   300
..................................................   350
..................................................   400
..................................................   450
..................................................   500

Simultaneous quantile regression                    Number of obs =         74
  bootstrap(500) SEs                                .25 Pseudo R2 =     0.0909
                                                    .50 Pseudo R2 =     0.1228
                                                    .75 Pseudo R2 =     0.2639

------------------------------------------------------------------------------
             |              Bootstrap
       price |      Coef.   Std. Err.      t    P>|t|     [95% Conf. Interval]
-------------+----------------------------------------------------------------
q25          |
mpg_quartile |
          2  |      -1297   528.3106    -2.45   0.017    -2350.682   -243.3178
          3  |      -1192   447.9346    -2.66   0.010    -2085.377   -298.6225
          4  |      -1484   458.6527    -3.24   0.002    -2398.754   -569.2459
             |
       _cons |       5379   414.9198    12.96   0.000     4551.468    6206.532
-------------+----------------------------------------------------------------
q50          |
mpg_quartile |
          2  |      -1442   1253.755    -1.15   0.254    -3942.535    1058.535
          3  |      -1086   1414.436    -0.77   0.445    -3907.004    1735.004
          4  |      -1776   1232.862    -1.44   0.154    -4234.867    682.8667
             |
       _cons |       6165   1221.461     5.05   0.000     3728.873    8601.127
-------------+----------------------------------------------------------------
q75          |
mpg_quartile |
          2  |      -6213   1591.987    -3.90   0.000    -9388.118   -3037.882
          3  |      -4535   1847.591    -2.45   0.017    -8219.904   -850.0963
          4  |      -6796   1592.095    -4.27   0.000    -9971.334   -3620.666
             |
       _cons |      11385   1556.486     7.31   0.000     8280.686    14489.31
------------------------------------------------------------------------------

. test ///
> ([q25]2.mpg_quart=[q25]3.mpg_quart=[q25]4.mpg_quart) ///
> ([q50]2.mpg_quart=[q50]3.mpg_quart=[q50]4.mpg_quart) ///
> ([q75]2.mpg_quart=[q75]3.mpg_quart=[q75]4.mpg_quart)

 ( 1)  [q25]2.mpg_quartile - [q25]3.mpg_quartile = 0
 ( 2)  [q25]2.mpg_quartile - [q25]4.mpg_quartile = 0
 ( 3)  [q50]2.mpg_quartile - [q50]3.mpg_quartile = 0
 ( 4)  [q50]2.mpg_quartile - [q50]4.mpg_quartile = 0
 ( 5)  [q75]2.mpg_quartile - [q75]3.mpg_quartile = 0
 ( 6)  [q75]2.mpg_quartile - [q75]4.mpg_quartile = 0

       F(  6,    70) =    1.10
            Prob > F =    0.3740
The ECDF looks like this:
Though there seem to be large differences between group 1 and groups 2-4 for the 3 quantiles in the graph. However, this is not a lot of data, so the failure to reject with the formal test is perhaps not that surprising because of the "micronumerosity".
Interestingly, the Kruskal-Wallis test of the hypothesis that 4 groups are from the same population rejects:
. kwallis price , by(mpg_quartile)

Kruskal-Wallis equality-of-populations rank test

  +---------------------------+
  | mpg_qu~e | Obs | Rank Sum |
  |----------+-----+----------|
  |        1 |  27 |  1397.00 |
  |        2 |  11 |   286.00 |
  |        3 |  22 |   798.00 |
  |        4 |  14 |   294.00 |
  +---------------------------+

chi-squared =    23.297 with 3 d.f.
probability =     0.0001

chi-squared with ties =    23.297 with 3 d.f.
probability =     0.0001

