I am trying to predict "daily_cases" using time series analysis.
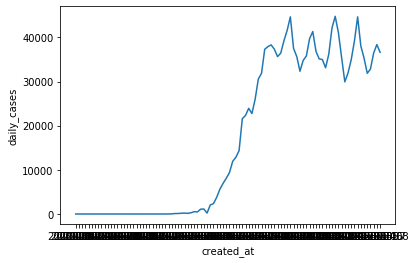
The time series plot looks like -

The ACF plot of original series is given below-
The above ACF plot suggests that trend is present which needs to be removed using appropriate differencing.
The ACF and PACF plots of 1-differenced series are given below-
The above plots suggest an ARMA(1,1) process which was also validated by "arma_order_select_ic()" function in python on the basis of "aic" and "bic" scores.
But, after fitting the model I get weird fitted values ,which were way different from observed values(differing by 10000!).
Please help.
Thanks in advance


