I believed that the most powerful hypothesis test for comparing two normal distributions with different mean values, but a common standard deviation, uses the average value as test statistics. However, I tried to calculate the sample size using a Monte Carlo simulation and compared the two cases: (a) using the numeric average value as test statistic, and (b) transforming the data first to ranks and then calculating the average value. What I found is that the ranked data yields a smaller sample size. How is that possible?
What I am finally interested in is to determine the sample size for a future experiment. Let's say that the specification limits are such that I like reject the null hypothesis, $H_0: \mu_0 = [-1, 1]$. Here is what I do:
I draw $n$ random numbers from each distribution $N(\mu_0, \sigma_0)$, and $N(\mu_1, \sigma_1)$, where $\mu_0 = 0$, $\mu_1 = 1$, and $\sigma_1=\sigma_0 = 1$. [I also checked $\mu_1 = 0.25$ and $0.5$ and obtain a similar result.]
I calculate the test statistic (average value).
I repeat step 1+2 "many" times (10 000) to obtain a reliable answer.
I calculate the producer and consumer risk and check whether they satisfy
- producer risk (type I error) $\alpha \le 5\%$ and simultaneously
- consumer risk (type II error) $\beta \le 20\%$.
- If the conditions in step 4 are not satisfied, I return to step 1, but increase the sample size $n$.
The hypothesis test I performed is two-sided. If I use the numeric values of the random numbers the conditions (step 4) are satisfied for the sample size $n=8$. This is fine and consistent with analytic calculations. However, if I transform the random numbers to ranks,
Example: (0.0590, 0.5607, 0.1573, 0.5472) becomes (1, 4, 2, 3)
and then calculate the test statistic (again the average value) the sample size is only $n = 5$.
Intuitively, I understand that the ranking increases the separation of the samples. However, it also does so if the random number drawn from $N(\mu_0, \sigma_0)$ is accidentally larger than the random number drawn from $N(\mu_1, \sigma_1)$. What am I missing? Is it just a bug in my program? What is the most powerful test for the described case?
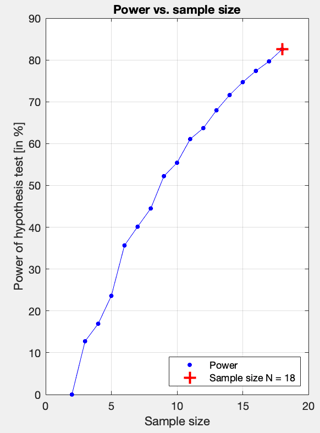
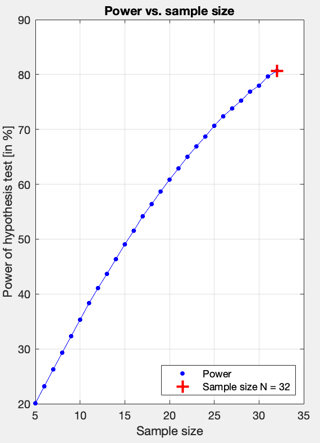
When I choose $\mu_1=0.5$ I obtain the following result:
The left image shows that the power of the hypothesis test is approx. 82% for $n=18$, if I use the ranked average. The right image shows that the numeric average needs a sample size of $n=32$ to reach the power approx. 81% for


