47
$\begingroup$

Im trying to use silhouette plot to determine the number of cluster in my dataset. Given the dataset Train , i used the following matlab code

Train_data = full(Train);  
Result = [];  
for num_of_cluster = 1:20  
    centroid = kmeans(Train_data,num_of_cluster,'distance','sqeuclid');  
    s = silhouette(Train_data,centroid,'sqeuclid');  
    Result = [ Result; num_of_cluster mean(s)];  
end  
plot( Result(:,1),Result(:,2),'r*-.');`

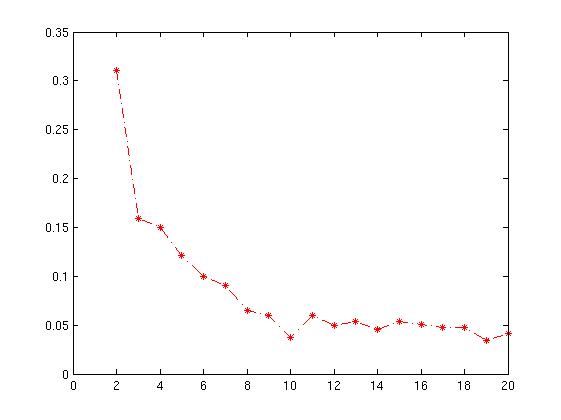
The resultant plot is given below with xaxis as number of cluster and yaxis mean of silhouette value.

How do i interpret this graph? How do i determine the number of cluster from this?

enter image description here

$\endgroup$
5
  • $\begingroup$ For determining the number of clusters, see the minimum spanning tree (MST) method under visualization-software-for-clustering. $\endgroup$
    – denis
    Commented Jul 1, 2011 at 8:40
  • $\begingroup$ @Learner: Is the silhouette function inbuilt in some library? If not, could you post it in your question if you don't mind? $\endgroup$
    – Legend
    Commented Jul 10, 2011 at 5:42
  • $\begingroup$ @Legend: Its available in Matlab Statistics toolbox. $\endgroup$
    – Learner
    Commented Jul 10, 2011 at 6:46
  • $\begingroup$ @Learner: Ooops... I thought you were using Python :) Thanks for letting me know about it. $\endgroup$
    – Legend
    Commented Jul 10, 2011 at 20:18
  • 1
    $\begingroup$ +1 for showing the code! Also, since the maximum mean of your silhouette occurs when k=2, you might want to check whether your data is clustered, which can be done using the gap statistic (another link). $\endgroup$ Commented Nov 7, 2013 at 18:38

4 Answers 4

58
$\begingroup$

Sergey's answer contains the critical point, which is that the silhouette coefficient quantifies the quality of clustering achieved -- so you should select the number of clusters that maximizes the silhouette coefficient.


The long answer is that the best way to evaluate the results of your clustering efforts is to start by actually examining -- human inspection -- the clusters formed and making a determination based on an understanding of what the data represents, what a cluster represents, and what the clustering is intended to achieve.

There are numerous quantitative methods of evaluating clustering results which should be used as tools, with full understanding of the limitations. They tend to be fairly intuitive in nature, and thus have a natural appeal (like clustering problems in general).

Examples: cluster mass / radius / density, cohesion or separation between clusters, etc. These concepts are often combined, for example, the ratio of separation to cohesion should be large if clustering was successful.

The way clustering is measured is informed by the type of clustering algorithms used. For example, measuring quality of a complete clustering algorithm (in which all points are put into clusters) can be very different from measuring quality of a threshold-based fuzzy clustering algorithm (in which some point might be left un-clustered as 'noise').


The silhouette coefficient is one such measure. It works as follows:

For each point p, first find the average distance between p and all other points in the same cluster (this is a measure of cohesion, call it A). Then find the average distance between p and all points in the nearest cluster (this is a measure of separation from the closest other cluster, call it B). The silhouette coefficient for p is defined as the difference between B and A divided by the greater of the two (max(A,B)).

We evaluate the cluster coefficient of each point and from this we can obtain the 'overall' average cluster coefficient.

Intuitively, we are trying to measure the space between clusters. If cluster cohesion is good (A is small) and cluster separation is good (B is large), the numerator will be large, etc.

I've constructed an example here to demonstrate this graphically.
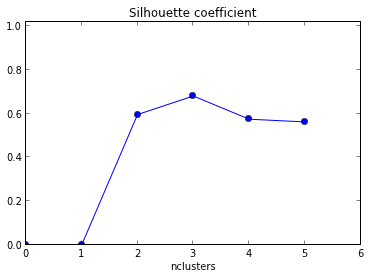
Clustering coefficient Results of clustering for nclusters = 2:5

In these plots the same data is plotted five times; the colors indicate the clusters created by k-means clustering, with k = 1,2,3,4,5. That is, I've forced a clustering algorithm to divide the data into 2 clusters, then 3, and so on, and colored the graph accordingly.

The silhouette plot shows the that the silhouette coefficient was highest when k = 3, suggesting that's the optimal number of clusters. In this example we are lucky to be able to visualize the data and we might agree that indeed, three clusters best captures the segmentation of this data set.

If we were unable to visualize the data, perhaps because of higher dimensionality, a silhouette plot would still give us a suggestion. However, I hope my somewhat long-winded answer here also makes the point that this "suggestion" could be very insufficient or just plain wrong in certain scenarios.
$\endgroup$
1
  • 7
    $\begingroup$ Thank you for your detailed answer, and especially the plots are very helpful. However, I did not quite understand how the average silhouette witdh "suggestion" could be very insufficient or just plain wrong in certain scenarios. as you claim. $\endgroup$
    – Zhubarb
    Commented May 13, 2015 at 16:16
16
$\begingroup$

I have been looking into the same thing today and found an interpretation here. It makes logical sense but I am not sure if we can blindly apply the interpretation for our datasets. In summary, what that article says is the following:

0.71-1.0
A strong structure has been found

0.51-0.70
A reasonable structure has been found

0.26-0.50
The structure is weak and could be artificial. Try additional methods of data analysis.

< 0.25
No substantial structure has been found

However, it seems like we can use the silhouette width to catch outliers. In a document clustering task that I am currently handling, the ones with negative silhouette width are definite outliers (when cross checked with their semantic meaning). I am not sure if this width will improve after removing outliers (again, this makes logical sense but I have not done this myself).

$\endgroup$
3
  • 7
    $\begingroup$ Just a history remark, the table originally comes from Sewell, Grandville, and P. J. Rousseau. "Finding groups in data: An introduction to cluster analysis." (1990). img546.imageshack.us/img546/4523/cnfg.png (maybe published earlier in one of the authors' articles) $\endgroup$ Commented Nov 7, 2013 at 18:34
  • $\begingroup$ The link in the answer is no longer available. Could you please provide another reference? $\endgroup$
    – BajajG
    Commented Oct 11, 2018 at 8:01
  • 2
    $\begingroup$ Here's the link to the article from the web archive: web.archive.org/web/20111002220803/http://www.unesco.org:80/… $\endgroup$
    – Justas
    Commented Dec 29, 2018 at 19:39
11
$\begingroup$

Take a look at the Cluster Validity Analysis Platform (CVAP) ToolBox And some of the materials (links) from CVAP:

Silhouette index (overall average silhouette) a larger Silhouette value indicates a better quality of a clustering result [Chen et al. 2002]

  • N. Bolshakova, F. Azuaje. 2003. Cluster validation techniques for genome expression data, Signal Processing. V.83. N4, P.825-833.
  • E. Dimitriadou, S. Dolnicar, A. Weingessel. An examination of indexes for determining the Number of Cluster in binary data sets. Psychometrika, 67(1):137-160, 2002.

You can also check this (simple) Tool for estimating the number of clusters

Just take a look at the examples of both toolkits (You can also use other cluster validation techniques)

$\endgroup$
2
$\begingroup$

If you are trying to select the number of clusters for unsupervised learning then maybe you could try doing something like-

http://scikit-learn.org/stable/auto_examples/cluster/plot_kmeans_silhouette_analysis.html

They use more than just the silhouette score mean (they use the distribution) but it makes sense. It seems to prefer smaller clusters but maybe you could try this with some generated data and see if works?

Alternatively, you can check this paper-

http://www.sciencedirect.com/science/article/pii/0377042787901257

$\endgroup$

Your Answer

By clicking “Post Your Answer”, you agree to our terms of service and acknowledge you have read our privacy policy.

Not the answer you're looking for? Browse other questions tagged or ask your own question.