First of all, we should understand what the R software is doing when no intercept
is included in the model. Recall that the usual computation of $R^2$
when an intercept is present is
$$
R^2 = \frac{\sum_i (\hat y_i - \bar y)^2}{\sum_i (y_i - \bar
y)^2} = 1 - \frac{\sum_i (y_i - \hat y_i)^2}{\sum_i (y_i - \bar
y)^2} \>.
$$
The first equality only occurs because of the inclusion of the
intercept in the model even though this is probably the more popular
of the two ways of writing it. The second equality actually provides
the more general interpretation! This point is also address in this
related question.
But, what happens if there is no intercept in the model?
Well, in that
case, R (silently!) uses the modified form
$$
R_0^2 = \frac{\sum_i \hat y_i^2}{\sum_i y_i^2} = 1 - \frac{\sum_i (y_i - \hat y_i)^2}{\sum_i y_i^2} \>.
$$
It helps to recall what $R^2$ is trying to measure. In the former
case, it is comparing your current model to the reference
model that only includes an intercept (i.e., constant term). In the
second case, there is no intercept, so it makes little sense to
compare it to such a model. So, instead, $R_0^2$ is computed, which
implicitly uses a reference model corresponding to noise only.
In what follows below, I focus on the second expression for both $R^2$ and $R_0^2$ since that expression generalizes to other contexts and it's generally more natural to think about things in terms of residuals.
But, how are they different, and when?
Let's take a brief digression into some linear algebra and see if we
can figure out what is going on. First of all, let's call the fitted
values from the model with intercept $\newcommand{\yhat}{\hat
{\mathbf y}}\newcommand{\ytilde}{\tilde {\mathbf y}}\yhat$ and the
fitted values from the model without intercept $\ytilde$.
We can rewrite
the expressions for $R^2$ and $R_0^2$ as
$$\newcommand{\y}{\mathbf y}\newcommand{\one}{\mathbf 1}
R^2 = 1 - \frac{\|\y - \yhat\|_2^2}{\|\y - \bar y \one\|_2^2} \>,
$$
and
$$
R_0^2 = 1 - \frac{\|\y - \ytilde\|_2^2}{\|\y\|_2^2} \>,
$$
respectively.
Now, since $\|\y\|_2^2 = \|\y - \bar y \one\|_2^2 + n \bar y^2$, then $R_0^2 > R^2$ if and only if
$$
\frac{\|\y - \ytilde\|_2^2}{\|\y - \yhat\|_2^2} < 1 + \frac{\bar
y^2}{\frac{1}{n}\|\y - \bar y \one\|_2^2} \> .
$$
The left-hand side is greater than one since the model corresponding
to $\ytilde$ is nested within that of $\yhat$. The second term on the
right-hand side is the squared-mean of the responses divided by the
mean square error of an intercept-only model. So, the larger the mean of the response relative to the other variation, the more "slack" we have and a greater chance of $R_0^2$ dominating $R^2$.
Notice that all the
model-dependent stuff is on the left side and non-model dependent
stuff is on the right.
Ok, so how do we make the ratio on the left-hand side small?
Recall that
$\newcommand{\P}{\mathbf P}\ytilde = \P_0 \y$ and $\yhat = \P_1 \y$ where $\P_0$ and $\P_1$ are
projection matrices corresponding to subspaces $S_0$ and $S_1$ such
that $S_0 \subset S_1$.
So, in order for the ratio to be close to one, we need the subspaces
$S_0$ and $S_1$ to be very similar. Now $S_0$ and $S_1$ differ only by
whether $\one$ is a basis vector or not, so that means that $S_0$
had better be a subspace that already lies very close to $\one$.
In essence, that means our predictor had better have a strong mean
offset itself and that this mean offset should dominate the variation
of the predictor.
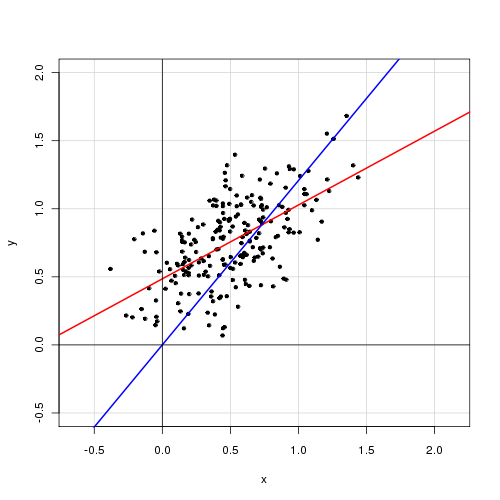
An example
Here we try to generate an example with an intercept explicitly in the model and which behaves close to the case in the question. Below is some simple R code to demonstrate.
set.seed(.Random.seed[1])

n <- 220
a <- 0.5
b <- 0.5
se <- 0.25

# Make sure x has a strong mean offset
x <- rnorm(n)/3 + a
y <- a + b*x + se*rnorm(x)

int.lm   <- lm(y~x)
noint.lm <- lm(y~x+0)  # Intercept be gone!

# For comparison to summary(.) output
rsq.int <- cor(y,x)^2
rsq.noint <- 1-mean((y-noint.lm$fit)^2) / mean(y^2)
This gives the following output. We begin with the model with intercept.
# Include an intercept!
> summary(int.lm)

Call:
lm(formula = y ~ x)

Residuals:
      Min        1Q    Median        3Q       Max
-0.656010 -0.161556 -0.005112  0.178008  0.621790

Coefficients:
            Estimate Std. Error t value Pr(>|t|)
(Intercept)  0.48521    0.02990   16.23   <2e-16 ***
x            0.54239    0.04929   11.00   <2e-16 ***
---
Signif. codes:  0 '***' 0.001 '**' 0.01 '*' 0.05 '.' 0.1 ' ' 1

Residual standard error: 0.2467 on 218 degrees of freedom
Multiple R-squared: 0.3571,     Adjusted R-squared: 0.3541
F-statistic: 121.1 on 1 and 218 DF,  p-value: < 2.2e-16
Then, see what happens when we exclude the intercept.
# No intercept!
> summary(noint.lm)

Call:
lm(formula = y ~ x + 0)

Residuals:
     Min       1Q   Median       3Q      Max
-0.62108 -0.08006  0.16295  0.38258  1.02485

Coefficients:
  Estimate Std. Error t value Pr(>|t|)
x  1.20712    0.04066   29.69   <2e-16 ***
---
Signif. codes:  0 '***' 0.001 '**' 0.01 '*' 0.05 '.' 0.1 ' ' 1

Residual standard error: 0.3658 on 219 degrees of freedom
Multiple R-squared: 0.801,      Adjusted R-squared: 0.8001
F-statistic: 881.5 on 1 and 219 DF,  p-value: < 2.2e-16
Below is a plot of the data with the model-with-intercept in red and the model-without-intercept in blue.


