Choosing the number K folds by considering the learning curve
I would like to argue that choosing the appropriate number of $K$ folds depends a lot on the shape and position of the learning curve, mostly due to its impact on the bias. This argument, which extends to leave-one-out CV, is largely taken from the book "Elements of Statistical Learning" chapter 7.10, page 243.
For discussions on the impact of $K$ on the variance see here
To summarize, if the learning curve has a considerable slope at the
given training set size, five- or tenfold cross-validation will
overestimate the true prediction error. Whether this bias is a
drawback in practice depends on the objective. On the other hand,
leave-one-out cross-validation has low bias but can have high
variance.
An intuitive visualization using a toy example
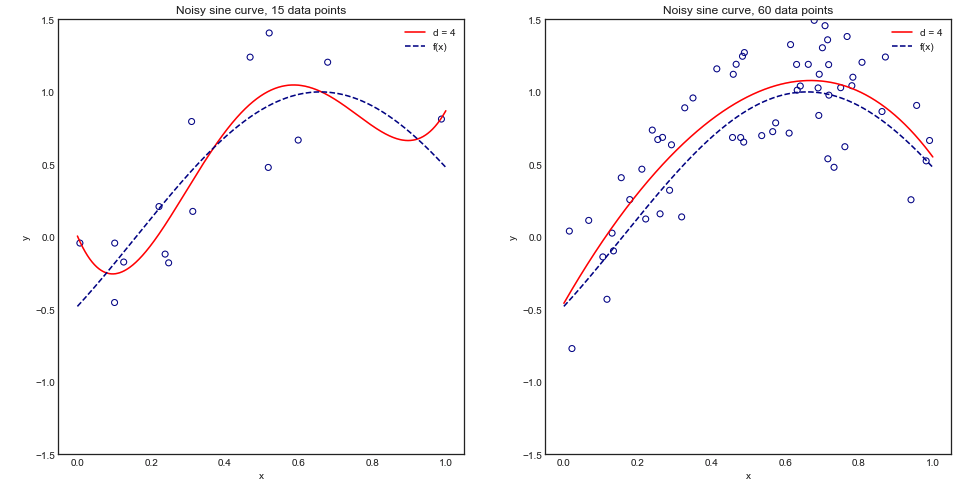
To understand this argument visually, consider the following toy example where we are fitting a degree 4 polynomial to a noisy sine curve:

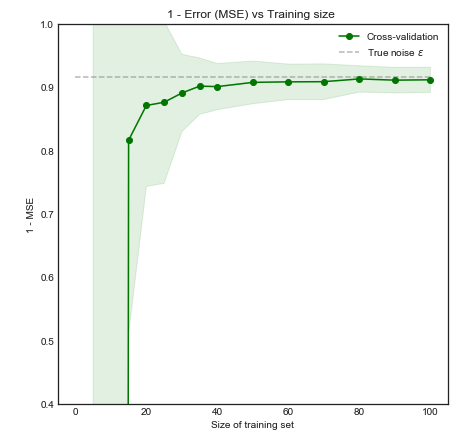
Intuitively and visually, we expect this model to fare poorly for small datasets due to overfitting. This behaviour is reflected in the learning curve where we plot $1 -$ Mean Square Error vs Training size together with $\pm$ 1 standard deviation. Note that I chose to plot 1 - MSE here to reproduce the illustration used in ESL page 243

Discussing the argument
The performance of the model improves significantly as the training size increases to 50 observations. Increasing the number further to 200 for example brings only small benefits. Consider the following two cases:
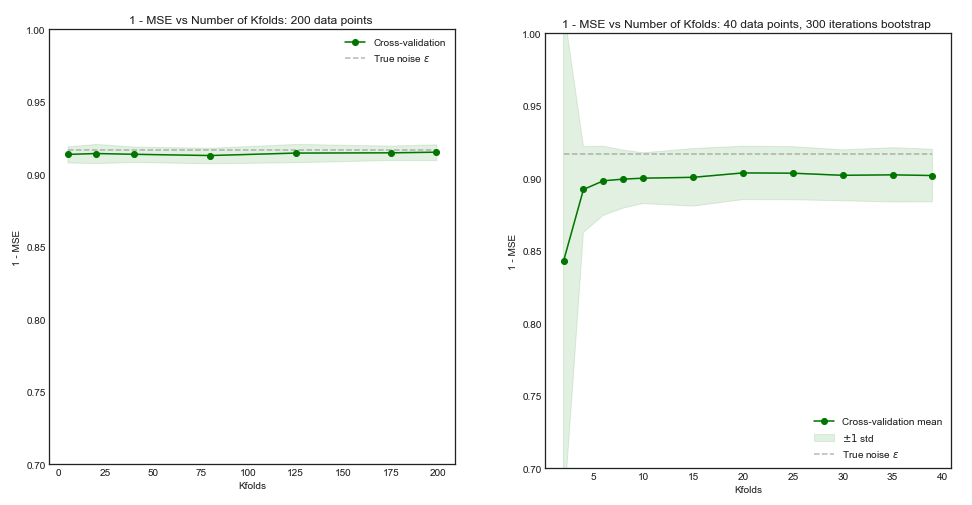
If our training set had 200 observations, $5$ fold cross validation would estimate the performance over a training size of 160 which is virtually the same as the performance for training set size 200. Thus cross-validation would not suffer from much bias and increasing $K$ to larger values will not bring much benefit (left hand plot)
However if the training set had $50$ observations, $5$ fold cross-validation would estimate the performance of the model over training sets of size 40, and from the learning curve this would lead to a biased result. Hence increasing $K$ in this case will tend to reduce the bias. (right hand plot).

[Update] - Comments on the methodology
You can find the code for this simulation here. The approach was the following:
- Generate 50,000 points from the distribution $sin(x) + \epsilon$ where the true variance of $\epsilon$ is known
- Iterate $i$ times (e.g. 100 or 200 times). At each iteration, change the dataset by resampling $N$ points from the original distribution
- For each data set $i$:
- Perform K-fold cross validation for one value of $K$
- Store the average Mean Square Error (MSE) across the K-folds
- Once the loop over $i$ is complete, calculate the mean and standard deviation of the MSE across the $i$ datasets for the same value of $K$
- Repeat the above steps for all $K$ in range $\{ 5,...,N\}$ all the way to LOOCV
An alternative approach is to not resample a new data set at each iteration and instead reshuffle the same dataset each time. This seems to give similar results.


