Tweeted twitter.com/#!/StackStats/status/67562360063275008
edited tags
Link
chl
  • 54.4k
  • 23
  • 227
  • 388
added 30 characters in body
Source Link
Learner
  • 4.5k
  • 12
  • 41
  • 40

Im trying to use silhouette plot to determine the number of cluster in my dataset. Given the dataset Train , i used the following matlab code

>Train_data = full(Train); Result = []; for num_of_cluster = 1:20 centroid = kmeans(Train_data,num_of_cluster,'distance','sqeuclid'); s = silhouette(Train_data,centroid,'sqeuclid'); Result = [ Result; num_of_cluster mean(s)]; end plot( Result(:,1),Result(:,2),'r*-.');

Train_data = full(Train);  
Result = [];  
for num_of_cluster = 1:20  
    centroid = kmeans(Train_data,num_of_cluster,'distance','sqeuclid');  
    s = silhouette(Train_data,centroid,'sqeuclid');  
    Result = [ Result; num_of_cluster mean(s)];  
end  
plot( Result(:,1),Result(:,2),'r*-.');`

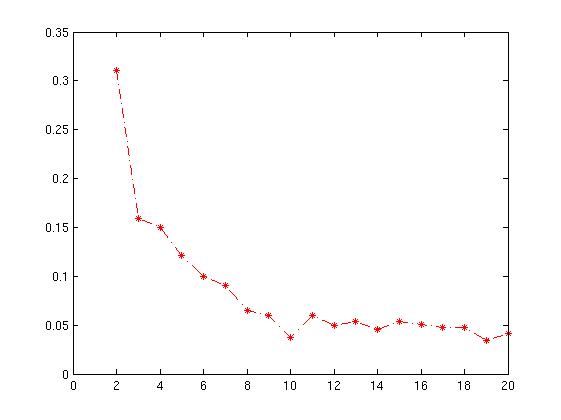
The resultant plot is given below with xaxis as number of cluster and yaxis mean of silhouette value.

How do i interpret this graph? How do i determine the number of cluster from this?
enter image description here

Im trying to use silhouette plot to determine the number of cluster in my dataset. Given the dataset Train , i used the following matlab code

>Train_data = full(Train); Result = []; for num_of_cluster = 1:20 centroid = kmeans(Train_data,num_of_cluster,'distance','sqeuclid'); s = silhouette(Train_data,centroid,'sqeuclid'); Result = [ Result; num_of_cluster mean(s)]; end plot( Result(:,1),Result(:,2),'r*-.');

The resultant plot is given below with xaxis as number of cluster and yaxis mean of silhouette value.

How do i interpret this graph? How do i determine the number of cluster from this?

enter image description here

Im trying to use silhouette plot to determine the number of cluster in my dataset. Given the dataset Train , i used the following matlab code

Train_data = full(Train);  
Result = [];  
for num_of_cluster = 1:20  
    centroid = kmeans(Train_data,num_of_cluster,'distance','sqeuclid');  
    s = silhouette(Train_data,centroid,'sqeuclid');  
    Result = [ Result; num_of_cluster mean(s)];  
end  
plot( Result(:,1),Result(:,2),'r*-.');`

The resultant plot is given below with xaxis as number of cluster and yaxis mean of silhouette value.

How do i interpret this graph? How do i determine the number of cluster from this?

enter image description here

Source Link
Learner
  • 4.5k
  • 12
  • 41
  • 40

How to interpret mean of Silhouette plot?

Im trying to use silhouette plot to determine the number of cluster in my dataset. Given the dataset Train , i used the following matlab code

>Train_data = full(Train); Result = []; for num_of_cluster = 1:20 centroid = kmeans(Train_data,num_of_cluster,'distance','sqeuclid'); s = silhouette(Train_data,centroid,'sqeuclid'); Result = [ Result; num_of_cluster mean(s)]; end plot( Result(:,1),Result(:,2),'r*-.');

The resultant plot is given below with xaxis as number of cluster and yaxis mean of silhouette value.

How do i interpret this graph? How do i determine the number of cluster from this?

enter image description here