Bounty Ended with 50 reputation awarded by rdorlearn
added 644 characters in body
Source Link
John
  • 2.3k
  • 6
  • 29
  • 37

enter image description here

If you would like do pre-cluster and find mean and covariance for noise prediction, you can do so using mixtools as follows:

require(mixtools)
out <- mvnormalmixEM(df, lambda = NULL, mu = NULL, sigma = NULL, k = 4,
 arbmean = TRUE, arbvar = TRUE, epsilon = 1e-08,  maxit = 10000, verb = FALSE)
out$mu 
out$sigma    out$mu 

[[1]]
[1] 10.03088 29.73584

[[2]]
[1] 23.25702 30.02964

[[3]]
[1] 34.92314 29.87429

[[4]]
[1] 59.86794 29.77950


out$sigma
[[1]]
           [,1]       [,2]
[1,]  0.9130767 -0.2981406
[2,] -0.2981406  7.4559937

[[2]]
           [,1]      [,2]
[1,] 100.751791 -1.319039
[2,]  -1.319039 12.157087

[[3]]
          [,1]      [,2]
[1,] 0.9950905 0.7062686
[2,] 0.7062686 8.8444094

[[4]]
           [,1]       [,2]
[1,]  1.0882691 -0.4201116
[2,] -0.4201116  9.4550932

enter image description here

If you would like do pre-cluster and find mean and covariance, you can do so using mixtools as follows:

require(mixtools)
out <- mvnormalmixEM(df, lambda = NULL, mu = NULL, sigma = NULL, k = 4,
 arbmean = TRUE, arbvar = TRUE, epsilon = 1e-08,  maxit = 10000, verb = FALSE)
out$mu 
out$sigma

enter image description here

enter image description here

If you would like do pre-cluster and find mean and covariance for noise prediction, you can do so using mixtools as follows:

require(mixtools)
out <- mvnormalmixEM(df, lambda = NULL, mu = NULL, sigma = NULL, k = 4,
 arbmean = TRUE, arbvar = TRUE, epsilon = 1e-08,  maxit = 10000, verb = FALSE)
    out$mu 

[[1]]
[1] 10.03088 29.73584

[[2]]
[1] 23.25702 30.02964

[[3]]
[1] 34.92314 29.87429

[[4]]
[1] 59.86794 29.77950


out$sigma
[[1]]
           [,1]       [,2]
[1,]  0.9130767 -0.2981406
[2,] -0.2981406  7.4559937

[[2]]
           [,1]      [,2]
[1,] 100.751791 -1.319039
[2,]  -1.319039 12.157087

[[3]]
          [,1]      [,2]
[1,] 0.9950905 0.7062686
[2,] 0.7062686 8.8444094

[[4]]
           [,1]       [,2]
[1,]  1.0882691 -0.4201116
[2,] -0.4201116  9.4550932
added 281 characters in body
Source Link
John
  • 2.3k
  • 6
  • 29
  • 37

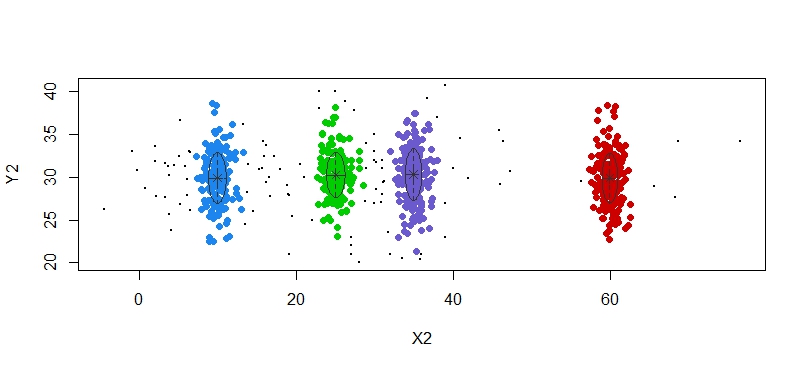
Here is solution using mixture model using package mcluster. The idea is provide prior outliers that fits the criteria of mean of Y or X variable plus twice sd of X or Y variable.

 X2 <- c(rnorm(150, 10, 1),rnorm(50, 10, 5),  rnorm(150, 25,1),
    rnorm(50, 25, 20), rnorm(200,35,1),  rnorm(200,60,1), rpois(50,30))
Y2 <- c(rnorm(800, 30, 3), rpois(50,30))
df <- cbind (X2, Y2)
plot(df, pch = 20, col = "gray40", ylim = c(15,45), xlim = c(-10, 90))

mean and variance calculation:

Xvar = sd(X2)
Xmean <- mean(X2)
Yvar = sd(Y2)
Ymean = mean (Y2))

Now identifying potential outliers:

noiseINIT <- X2 > (Xmean + Xvar*2) & Y2 >(Ymean + Yvar*2)

Here note that variation is not for particular cluster variance rather global mean and variance, not within each cluster. If someone has different idea please suggest.

dfbic <- mclustBIC(df,G=4,
initialization = list(noise = noiseINIT))

dfsummary <- summary(dfbic, df)
dfsummary
mclust2Dplot(df, classification=dfsummary$classification,
parameters=dfsummary$parameters,  symbols = 18)

If you would like do pre-cluster and find mean and covariance, you can do so using mixtools as follows:

require(mixtools)
out <- mvnormalmixEM(df, lambda = NULL, mu = NULL, sigma = NULL, k = 4,
 arbmean = TRUE, arbvar = TRUE, epsilon = 1e-08,  maxit = 10000, verb = FALSE)
out$mu 
out$sigma

enter image description here

Here is solution using mixture model using package mcluster. The idea is provide prior outliers that fits the criteria of mean of Y or X variable plus twice sd of X or Y variable.

 X2 <- c(rnorm(150, 10, 1),rnorm(50, 10, 5),  rnorm(150, 25,1),
    rnorm(50, 25, 20), rnorm(200,35,1),  rnorm(200,60,1), rpois(50,30))
Y2 <- c(rnorm(800, 30, 3), rpois(50,30))
df <- cbind (X2, Y2)
plot(df, pch = 20, col = "gray40", ylim = c(15,45), xlim = c(-10, 90))

mean and variance calculation:

Xvar = sd(X2)
Xmean <- mean(X2)
Yvar = sd(Y2)
Ymean = mean (Y2))

Now identifying potential outliers:

noiseINIT <- X2 > (Xmean + Xvar*2) & Y2 >(Ymean + Yvar*2)

Here note that variation is not for particular cluster variance rather global mean and variance, not within each cluster. If someone has different idea please suggest.

dfbic <- mclustBIC(df,G=4,
initialization = list(noise = noiseINIT))

dfsummary <- summary(dfbic, df)
dfsummary
mclust2Dplot(df, classification=dfsummary$classification,
parameters=dfsummary$parameters,  symbols = 18)

enter image description here

Here is solution using mixture model using package mcluster. The idea is provide prior outliers that fits the criteria of mean of Y or X variable plus twice sd of X or Y variable.

 X2 <- c(rnorm(150, 10, 1),rnorm(50, 10, 5),  rnorm(150, 25,1),
    rnorm(50, 25, 20), rnorm(200,35,1),  rnorm(200,60,1), rpois(50,30))
Y2 <- c(rnorm(800, 30, 3), rpois(50,30))
df <- cbind (X2, Y2)
plot(df, pch = 20, col = "gray40", ylim = c(15,45), xlim = c(-10, 90))

mean and variance calculation:

Xvar = sd(X2)
Xmean <- mean(X2)
Yvar = sd(Y2)
Ymean = mean (Y2))

Now identifying potential outliers:

noiseINIT <- X2 > (Xmean + Xvar*2) & Y2 >(Ymean + Yvar*2)

Here note that variation is not for particular cluster variance rather global mean and variance, not within each cluster.

dfbic <- mclustBIC(df,G=4,
initialization = list(noise = noiseINIT))

dfsummary <- summary(dfbic, df)
dfsummary
mclust2Dplot(df, classification=dfsummary$classification,
parameters=dfsummary$parameters,  symbols = 18)

If you would like do pre-cluster and find mean and covariance, you can do so using mixtools as follows:

require(mixtools)
out <- mvnormalmixEM(df, lambda = NULL, mu = NULL, sigma = NULL, k = 4,
 arbmean = TRUE, arbvar = TRUE, epsilon = 1e-08,  maxit = 10000, verb = FALSE)
out$mu 
out$sigma

enter image description here

Source Link
John
  • 2.3k
  • 6
  • 29
  • 37

Here is solution using mixture model using package mcluster. The idea is provide prior outliers that fits the criteria of mean of Y or X variable plus twice sd of X or Y variable.

 X2 <- c(rnorm(150, 10, 1),rnorm(50, 10, 5),  rnorm(150, 25,1),
    rnorm(50, 25, 20), rnorm(200,35,1),  rnorm(200,60,1), rpois(50,30))
Y2 <- c(rnorm(800, 30, 3), rpois(50,30))
df <- cbind (X2, Y2)
plot(df, pch = 20, col = "gray40", ylim = c(15,45), xlim = c(-10, 90))

mean and variance calculation:

Xvar = sd(X2)
Xmean <- mean(X2)
Yvar = sd(Y2)
Ymean = mean (Y2))

Now identifying potential outliers:

noiseINIT <- X2 > (Xmean + Xvar*2) & Y2 >(Ymean + Yvar*2)

Here note that variation is not for particular cluster variance rather global mean and variance, not within each cluster. If someone has different idea please suggest.

dfbic <- mclustBIC(df,G=4,
initialization = list(noise = noiseINIT))

dfsummary <- summary(dfbic, df)
dfsummary
mclust2Dplot(df, classification=dfsummary$classification,
parameters=dfsummary$parameters,  symbols = 18)

enter image description here