attempted to fix formatting
Source Link
Livid
  • 1.2k
  • 7
  • 16
require(beanplot)
require(lme4)

dat.full<-structure(list(Subject = c(1L, 1L, 1L, 1L, 1L, 2L, 2L, 2L, 2L, 
2L, 3L, 3L, 3L, 3L, 3L, 4L, 4L, 4L, 4L, 4L, 5L, 5L, 5L, 5L, 5L, 
6L, 6L, 6L, 6L, 6L, 7L, 7L, 7L, 7L, 7L, 8L, 8L, 8L, 8L, 8L), 
    Treatment = structure(c(4L, 5L, 3L, 1L, 2L, 3L, 4L, 2L, 5L, 
    1L, 2L, 3L, 1L, 4L, 5L, 4L, 5L, 3L, 1L, 2L, 3L, 4L, 2L, 5L, 
    1L, 5L, 1L, 4L, 2L, 3L, 4L, 5L, 3L, 1L, 2L, 3L, 4L, 2L, 5L, 
    1L), .Label = c("A", "B", "C", "D", "E"), class = "factor"), 
    Site = c(1L, 1L, 1L, 1L, 1L, 1L, 1L, 1L, 1L, 1L, 1L, 1L, 
    1L, 1L, 1L, 2L, 2L, 2L, 2L, 2L, 2L, 2L, 2L, 2L, 2L, 7L, 7L, 
    7L, 7L, 7L, 7L, 7L, 7L, 7L, 7L, 7L, 7L, 7L, 7L, 7L), y = c(5.68387, 
    5.65, 4.45098, 0.79048, 4.50455, 4.13208, 5.10459, 4.34468, 
    5.07556, 2.36296, -0.77037, 0.59167, -1.53191, 3.42, 2.89231, 
    4.80312, 5.60606, 5.38, 0.39474, 3.97714, 4.46667, 5.73333, 
    6.17391, 4.86957, -0.02, 4.4875, -2.10667, 5.71579, 1.17895, 
    0.97576, 3.05083, 3.25473, 2.7925, 1.23, 3.98769, 4.32754, 
    5.2875, 4.46575, 4.12787, 0.61481)), .Names = c("Subject", 
"Treatment", "Site", "y"), class = "data.frame", row.names = c(NA, 
-40L))


par(mfrow=c(2,2))
beanplot(dat.full$y~dat.full$Subject, xlab="Subject", 
         ylim=c(min(dat.full$y)-1, max(dat.full$y)+1))
beanplot(dat.full$y~dat.full$Site, xlab="Site", 
         ylim=c(min(dat.full$y)-1, max(dat.full$y)+1))
beanplot(dat.full$y~dat.full$Treatment, xlab="Treatment", 
         ylim=c(min(dat.full$y)-1, max(dat.full$y)+1))

Nsubj<-length(unique(dat.full$Subject))
plot(0,0, type="n",xlim=c(1,5), xaxt="n", xlab="Treatment",
     ylab="Y",  ylim=c(min(dat.full$y)-1, max(dat.full$y)+1))
axis(side=1, at=as.numeric(unique(dat.full$Treatment)),
     labels=unique(dat.full$Treatment))
for(i in 1:Nsubj){
  sub<-dat.full[which(dat.full$Subject==unique(dat.full$Subject)[i]),]
  sub<-sub[sort(as.numeric(sub$Treatment), index.return=T)$ix,]
  lines(sub$Treatment,sub$y, col=rainbow(Nsubj)[i], lwd=3)
}
legend("bottomright", legend=unique(dat.full$Subject), col=rainbow(Nsubj), 
       lwd=4, title="Subject", ncol=2)


dat1<-dat.full[which(dat.full$Site %in% 1),]
dat27<-dat.full[which(dat.full$Site %in% c(2,7)),] 

fit.all<-lmer(dat.full$y~dat.full$Treatment + (1|dat.full$Subject))
fit1<-lmer(dat1$y~dat1$Treatment + (1|dat1$Subject))
fit27<-lmer(dat27$y~dat27$Treatment + (1|dat27$Subject))
> fit.all
Linear mixed model fit by REML ['lmerMod']
Formula: dat.full$y ~ dat.full$Treatment + (1 | dat.full$Subject)
REML criterion at convergence: 127.467
Random effects:
 Groups           Name        Std.Dev.
 dat.full$Subject (Intercept) 1.142   
     Residual                     1.064   
Number of obs: 40, groups:  dat.full$Subject, 8
Fixed Effects:
        (Intercept)  dat.full$TreatmentB  dat.full$TreatmentC  
             0.2168               3.2660               3.1728  
dat.full$TreatmentD  dat.full$TreatmentE  
             4.6331               4.2786  
> fit1
Linear mixed model fit by REML ['lmerMod']
Formula: dat1$y ~ dat1$Treatment + (1 | dat1$Subject)
REML criterion at convergence: 37.0667
Random effects:
 Groups       Name        Std.Dev.
 dat1$Subject (Intercept) 1.8608  
 Residual                 0.8506  
Number of obs: 15, groups:  dat1$Subject, 3
Fixed Effects:
    (Intercept)  dat1$TreatmentB  dat1$TreatmentC  dat1$TreatmentD  
         0.5405           2.1524           2.5177           4.1956  
dat1$TreatmentE  
         3.9988  
> fit27
Linear mixed model fit by REML ['lmerMod']
Formula: dat27$y ~ dat27$Treatment + (1 | dat27$Subject)
REML criterion at convergence: 76.0409
Random effects:
 Groups        Name        Std.Dev.
 dat27$Subject (Intercept) 0.7462  
     Residual                  1.1876  
Number of obs: 25, groups:  dat27$Subject, 5
Fixed Effects:
     (Intercept)  dat27$TreatmentB  dat27$TreatmentC  dat27$TreatmentD  
         0.02258           3.93411           3.56592           4.89554  
dat27$TreatmentE  
         4.44657  
require(beanplot)
require(lme4)

dat.full<-structure(list(Subject = c(1L, 1L, 1L, 1L, 1L, 2L, 2L, 2L, 2L, 
2L, 3L, 3L, 3L, 3L, 3L, 4L, 4L, 4L, 4L, 4L, 5L, 5L, 5L, 5L, 5L, 
6L, 6L, 6L, 6L, 6L, 7L, 7L, 7L, 7L, 7L, 8L, 8L, 8L, 8L, 8L), 
    Treatment = structure(c(4L, 5L, 3L, 1L, 2L, 3L, 4L, 2L, 5L, 
    1L, 2L, 3L, 1L, 4L, 5L, 4L, 5L, 3L, 1L, 2L, 3L, 4L, 2L, 5L, 
    1L, 5L, 1L, 4L, 2L, 3L, 4L, 5L, 3L, 1L, 2L, 3L, 4L, 2L, 5L, 
    1L), .Label = c("A", "B", "C", "D", "E"), class = "factor"), 
    Site = c(1L, 1L, 1L, 1L, 1L, 1L, 1L, 1L, 1L, 1L, 1L, 1L, 
    1L, 1L, 1L, 2L, 2L, 2L, 2L, 2L, 2L, 2L, 2L, 2L, 2L, 7L, 7L, 
    7L, 7L, 7L, 7L, 7L, 7L, 7L, 7L, 7L, 7L, 7L, 7L, 7L), y = c(5.68387, 
    5.65, 4.45098, 0.79048, 4.50455, 4.13208, 5.10459, 4.34468, 
    5.07556, 2.36296, -0.77037, 0.59167, -1.53191, 3.42, 2.89231, 
    4.80312, 5.60606, 5.38, 0.39474, 3.97714, 4.46667, 5.73333, 
    6.17391, 4.86957, -0.02, 4.4875, -2.10667, 5.71579, 1.17895, 
    0.97576, 3.05083, 3.25473, 2.7925, 1.23, 3.98769, 4.32754, 
    5.2875, 4.46575, 4.12787, 0.61481)), .Names = c("Subject", 
"Treatment", "Site", "y"), class = "data.frame", row.names = c(NA, 
-40L))


par(mfrow=c(2,2))
beanplot(dat.full$y~dat.full$Subject, xlab="Subject", 
         ylim=c(min(dat.full$y)-1, max(dat.full$y)+1))
beanplot(dat.full$y~dat.full$Site, xlab="Site", 
         ylim=c(min(dat.full$y)-1, max(dat.full$y)+1))
beanplot(dat.full$y~dat.full$Treatment, xlab="Treatment", 
         ylim=c(min(dat.full$y)-1, max(dat.full$y)+1))

Nsubj<-length(unique(dat.full$Subject))
plot(0,0, type="n",xlim=c(1,5), xaxt="n", xlab="Treatment",
     ylab="Y",  ylim=c(min(dat.full$y)-1, max(dat.full$y)+1))
axis(side=1, at=as.numeric(unique(dat.full$Treatment)),
     labels=unique(dat.full$Treatment))
for(i in 1:Nsubj){
  sub<-dat.full[which(dat.full$Subject==unique(dat.full$Subject)[i]),]
  sub<-sub[sort(as.numeric(sub$Treatment), index.return=T)$ix,]
  lines(sub$Treatment,sub$y, col=rainbow(Nsubj)[i], lwd=3)
}
legend("bottomright", legend=unique(dat.full$Subject), col=rainbow(Nsubj), 
       lwd=4, title="Subject", ncol=2)


dat1<-dat.full[which(dat.full$Site %in% 1),]
dat27<-dat.full[which(dat.full$Site %in% c(2,7)),]
fit.all<-lmer(dat.full$y~dat.full$Treatment + (1|dat.full$Subject))
fit1<-lmer(dat1$y~dat1$Treatment + (1|dat1$Subject))
fit27<-lmer(dat27$y~dat27$Treatment + (1|dat27$Subject))
> fit.all
Linear mixed model fit by REML ['lmerMod']
Formula: dat.full$y ~ dat.full$Treatment + (1 | dat.full$Subject)
REML criterion at convergence: 127.467
Random effects:
 Groups           Name        Std.Dev.
 dat.full$Subject (Intercept) 1.142   
 Residual                     1.064   
Number of obs: 40, groups:  dat.full$Subject, 8
Fixed Effects:
        (Intercept)  dat.full$TreatmentB  dat.full$TreatmentC  
             0.2168               3.2660               3.1728  
dat.full$TreatmentD  dat.full$TreatmentE  
             4.6331               4.2786  
> fit1
Linear mixed model fit by REML ['lmerMod']
Formula: dat1$y ~ dat1$Treatment + (1 | dat1$Subject)
REML criterion at convergence: 37.0667
Random effects:
 Groups       Name        Std.Dev.
 dat1$Subject (Intercept) 1.8608  
 Residual                 0.8506  
Number of obs: 15, groups:  dat1$Subject, 3
Fixed Effects:
    (Intercept)  dat1$TreatmentB  dat1$TreatmentC  dat1$TreatmentD  
         0.5405           2.1524           2.5177           4.1956  
dat1$TreatmentE  
         3.9988  
> fit27
Linear mixed model fit by REML ['lmerMod']
Formula: dat27$y ~ dat27$Treatment + (1 | dat27$Subject)
REML criterion at convergence: 76.0409
Random effects:
 Groups        Name        Std.Dev.
 dat27$Subject (Intercept) 0.7462  
 Residual                  1.1876  
Number of obs: 25, groups:  dat27$Subject, 5
Fixed Effects:
     (Intercept)  dat27$TreatmentB  dat27$TreatmentC  dat27$TreatmentD  
         0.02258           3.93411           3.56592           4.89554  
dat27$TreatmentE  
         4.44657  
require(beanplot)
require(lme4)

dat.full<-structure(list(Subject = c(1L, 1L, 1L, 1L, 1L, 2L, 2L, 2L, 2L, 
2L, 3L, 3L, 3L, 3L, 3L, 4L, 4L, 4L, 4L, 4L, 5L, 5L, 5L, 5L, 5L, 
6L, 6L, 6L, 6L, 6L, 7L, 7L, 7L, 7L, 7L, 8L, 8L, 8L, 8L, 8L), 
    Treatment = structure(c(4L, 5L, 3L, 1L, 2L, 3L, 4L, 2L, 5L, 
    1L, 2L, 3L, 1L, 4L, 5L, 4L, 5L, 3L, 1L, 2L, 3L, 4L, 2L, 5L, 
    1L, 5L, 1L, 4L, 2L, 3L, 4L, 5L, 3L, 1L, 2L, 3L, 4L, 2L, 5L, 
    1L), .Label = c("A", "B", "C", "D", "E"), class = "factor"), 
    Site = c(1L, 1L, 1L, 1L, 1L, 1L, 1L, 1L, 1L, 1L, 1L, 1L, 
    1L, 1L, 1L, 2L, 2L, 2L, 2L, 2L, 2L, 2L, 2L, 2L, 2L, 7L, 7L, 
    7L, 7L, 7L, 7L, 7L, 7L, 7L, 7L, 7L, 7L, 7L, 7L, 7L), y = c(5.68387, 
    5.65, 4.45098, 0.79048, 4.50455, 4.13208, 5.10459, 4.34468, 
    5.07556, 2.36296, -0.77037, 0.59167, -1.53191, 3.42, 2.89231, 
    4.80312, 5.60606, 5.38, 0.39474, 3.97714, 4.46667, 5.73333, 
    6.17391, 4.86957, -0.02, 4.4875, -2.10667, 5.71579, 1.17895, 
    0.97576, 3.05083, 3.25473, 2.7925, 1.23, 3.98769, 4.32754, 
    5.2875, 4.46575, 4.12787, 0.61481)), .Names = c("Subject", 
"Treatment", "Site", "y"), class = "data.frame", row.names = c(NA, 
-40L))


par(mfrow=c(2,2))
beanplot(dat.full$y~dat.full$Subject, xlab="Subject", 
         ylim=c(min(dat.full$y)-1, max(dat.full$y)+1))
beanplot(dat.full$y~dat.full$Site, xlab="Site", 
         ylim=c(min(dat.full$y)-1, max(dat.full$y)+1))
beanplot(dat.full$y~dat.full$Treatment, xlab="Treatment", 
         ylim=c(min(dat.full$y)-1, max(dat.full$y)+1))

Nsubj<-length(unique(dat.full$Subject))
plot(0,0, type="n",xlim=c(1,5), xaxt="n", xlab="Treatment",
     ylab="Y",  ylim=c(min(dat.full$y)-1, max(dat.full$y)+1))
axis(side=1, at=as.numeric(unique(dat.full$Treatment)),
     labels=unique(dat.full$Treatment))
for(i in 1:Nsubj){
  sub<-dat.full[which(dat.full$Subject==unique(dat.full$Subject)[i]),]
  sub<-sub[sort(as.numeric(sub$Treatment), index.return=T)$ix,]
  lines(sub$Treatment,sub$y, col=rainbow(Nsubj)[i], lwd=3)
}
legend("bottomright", legend=unique(dat.full$Subject), col=rainbow(Nsubj), 
       lwd=4, title="Subject", ncol=2)


dat1<-dat.full[which(dat.full$Site %in% 1),]
dat27<-dat.full[which(dat.full$Site %in% c(2,7)),] 

fit.all<-lmer(dat.full$y~dat.full$Treatment + (1|dat.full$Subject))
fit1<-lmer(dat1$y~dat1$Treatment + (1|dat1$Subject))
fit27<-lmer(dat27$y~dat27$Treatment + (1|dat27$Subject))
> fit.all
Linear mixed model fit by REML ['lmerMod']
Formula: dat.full$y ~ dat.full$Treatment + (1 | dat.full$Subject)
REML criterion at convergence: 127.467
Random effects:
 Groups           Name        Std.Dev.
 dat.full$Subject (Intercept) 1.142   
     Residual                     1.064   
Number of obs: 40, groups:  dat.full$Subject, 8
Fixed Effects:
        (Intercept)  dat.full$TreatmentB  dat.full$TreatmentC  
             0.2168               3.2660               3.1728  
dat.full$TreatmentD  dat.full$TreatmentE  
             4.6331               4.2786  
> fit1
Linear mixed model fit by REML ['lmerMod']
Formula: dat1$y ~ dat1$Treatment + (1 | dat1$Subject)
REML criterion at convergence: 37.0667
Random effects:
 Groups       Name        Std.Dev.
 dat1$Subject (Intercept) 1.8608  
 Residual                 0.8506  
Number of obs: 15, groups:  dat1$Subject, 3
Fixed Effects:
    (Intercept)  dat1$TreatmentB  dat1$TreatmentC  dat1$TreatmentD  
         0.5405           2.1524           2.5177           4.1956  
dat1$TreatmentE  
         3.9988  
> fit27
Linear mixed model fit by REML ['lmerMod']
Formula: dat27$y ~ dat27$Treatment + (1 | dat27$Subject)
REML criterion at convergence: 76.0409
Random effects:
 Groups        Name        Std.Dev.
 dat27$Subject (Intercept) 0.7462  
     Residual                  1.1876  
Number of obs: 25, groups:  dat27$Subject, 5
Fixed Effects:
     (Intercept)  dat27$TreatmentB  dat27$TreatmentC  dat27$TreatmentD  
         0.02258           3.93411           3.56592           4.89554  
dat27$TreatmentE  
         4.44657  
Source Link
Livid
  • 1.2k
  • 7
  • 16

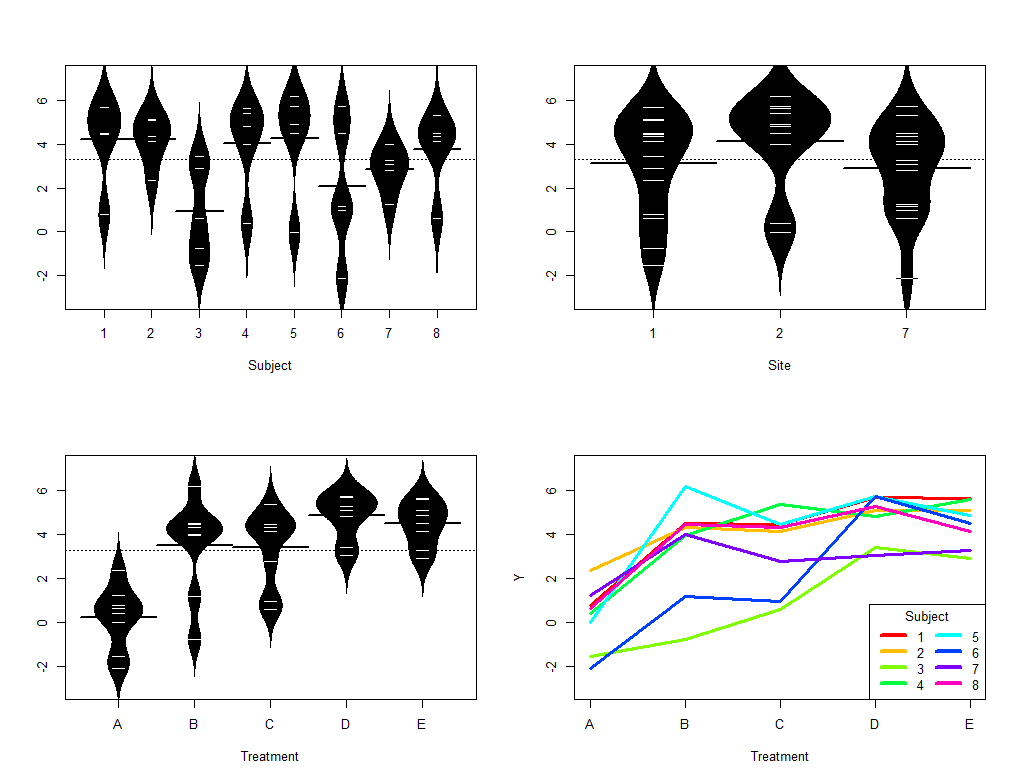
The situation is somewhat different from what I thought. In case someone else can answer it, here is the data and my understanding of (I do not know SAS well...) the analysis in R:

require(beanplot)
require(lme4)

dat.full<-structure(list(Subject = c(1L, 1L, 1L, 1L, 1L, 2L, 2L, 2L, 2L, 
2L, 3L, 3L, 3L, 3L, 3L, 4L, 4L, 4L, 4L, 4L, 5L, 5L, 5L, 5L, 5L, 
6L, 6L, 6L, 6L, 6L, 7L, 7L, 7L, 7L, 7L, 8L, 8L, 8L, 8L, 8L), 
    Treatment = structure(c(4L, 5L, 3L, 1L, 2L, 3L, 4L, 2L, 5L, 
    1L, 2L, 3L, 1L, 4L, 5L, 4L, 5L, 3L, 1L, 2L, 3L, 4L, 2L, 5L, 
    1L, 5L, 1L, 4L, 2L, 3L, 4L, 5L, 3L, 1L, 2L, 3L, 4L, 2L, 5L, 
    1L), .Label = c("A", "B", "C", "D", "E"), class = "factor"), 
    Site = c(1L, 1L, 1L, 1L, 1L, 1L, 1L, 1L, 1L, 1L, 1L, 1L, 
    1L, 1L, 1L, 2L, 2L, 2L, 2L, 2L, 2L, 2L, 2L, 2L, 2L, 7L, 7L, 
    7L, 7L, 7L, 7L, 7L, 7L, 7L, 7L, 7L, 7L, 7L, 7L, 7L), y = c(5.68387, 
    5.65, 4.45098, 0.79048, 4.50455, 4.13208, 5.10459, 4.34468, 
    5.07556, 2.36296, -0.77037, 0.59167, -1.53191, 3.42, 2.89231, 
    4.80312, 5.60606, 5.38, 0.39474, 3.97714, 4.46667, 5.73333, 
    6.17391, 4.86957, -0.02, 4.4875, -2.10667, 5.71579, 1.17895, 
    0.97576, 3.05083, 3.25473, 2.7925, 1.23, 3.98769, 4.32754, 
    5.2875, 4.46575, 4.12787, 0.61481)), .Names = c("Subject", 
"Treatment", "Site", "y"), class = "data.frame", row.names = c(NA, 
-40L))


par(mfrow=c(2,2))
beanplot(dat.full$y~dat.full$Subject, xlab="Subject", 
         ylim=c(min(dat.full$y)-1, max(dat.full$y)+1))
beanplot(dat.full$y~dat.full$Site, xlab="Site", 
         ylim=c(min(dat.full$y)-1, max(dat.full$y)+1))
beanplot(dat.full$y~dat.full$Treatment, xlab="Treatment", 
         ylim=c(min(dat.full$y)-1, max(dat.full$y)+1))

Nsubj<-length(unique(dat.full$Subject))
plot(0,0, type="n",xlim=c(1,5), xaxt="n", xlab="Treatment",
     ylab="Y",  ylim=c(min(dat.full$y)-1, max(dat.full$y)+1))
axis(side=1, at=as.numeric(unique(dat.full$Treatment)),
     labels=unique(dat.full$Treatment))
for(i in 1:Nsubj){
  sub<-dat.full[which(dat.full$Subject==unique(dat.full$Subject)[i]),]
  sub<-sub[sort(as.numeric(sub$Treatment), index.return=T)$ix,]
  lines(sub$Treatment,sub$y, col=rainbow(Nsubj)[i], lwd=3)
}
legend("bottomright", legend=unique(dat.full$Subject), col=rainbow(Nsubj), 
       lwd=4, title="Subject", ncol=2)


dat1<-dat.full[which(dat.full$Site %in% 1),]
dat27<-dat.full[which(dat.full$Site %in% c(2,7)),]
fit.all<-lmer(dat.full$y~dat.full$Treatment + (1|dat.full$Subject))
fit1<-lmer(dat1$y~dat1$Treatment + (1|dat1$Subject))
fit27<-lmer(dat27$y~dat27$Treatment + (1|dat27$Subject))

enter image description here

> fit.all
Linear mixed model fit by REML ['lmerMod']
Formula: dat.full$y ~ dat.full$Treatment + (1 | dat.full$Subject)
REML criterion at convergence: 127.467
Random effects:
 Groups           Name        Std.Dev.
 dat.full$Subject (Intercept) 1.142   
 Residual                     1.064   
Number of obs: 40, groups:  dat.full$Subject, 8
Fixed Effects:
        (Intercept)  dat.full$TreatmentB  dat.full$TreatmentC  
             0.2168               3.2660               3.1728  
dat.full$TreatmentD  dat.full$TreatmentE  
             4.6331               4.2786  
> fit1
Linear mixed model fit by REML ['lmerMod']
Formula: dat1$y ~ dat1$Treatment + (1 | dat1$Subject)
REML criterion at convergence: 37.0667
Random effects:
 Groups       Name        Std.Dev.
 dat1$Subject (Intercept) 1.8608  
 Residual                 0.8506  
Number of obs: 15, groups:  dat1$Subject, 3
Fixed Effects:
    (Intercept)  dat1$TreatmentB  dat1$TreatmentC  dat1$TreatmentD  
         0.5405           2.1524           2.5177           4.1956  
dat1$TreatmentE  
         3.9988  
> fit27
Linear mixed model fit by REML ['lmerMod']
Formula: dat27$y ~ dat27$Treatment + (1 | dat27$Subject)
REML criterion at convergence: 76.0409
Random effects:
 Groups        Name        Std.Dev.
 dat27$Subject (Intercept) 0.7462  
 Residual                  1.1876  
Number of obs: 25, groups:  dat27$Subject, 5
Fixed Effects:
     (Intercept)  dat27$TreatmentB  dat27$TreatmentC  dat27$TreatmentD  
         0.02258           3.93411           3.56592           4.89554  
dat27$TreatmentE  
         4.44657  

My understanding is that @AaronZeng wants to know under what conditions the residuals can be fit.all>fit27>fit1. This is not the case in the example data.