You cannot map AUC to contingency tables because AUC does not contain any information about the shape of the curve (e.g. does your model work well at high precision or high recall?).
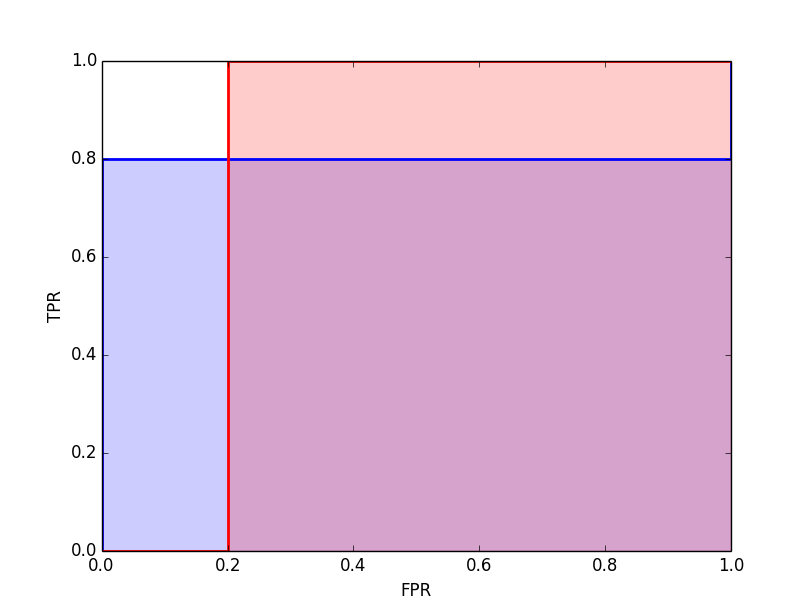
To see this, suppose you have an AUC of 80%. You could obtain this AUC in several ways, the simplest being "rectangular" ROC curves (this is contrived but still valid): (1) a model that has TPR of 0.8 at FPR up to 1 or (b) a model that has TPR of 1 at FPR of 0.2.
The following rankings both produce such "rectangular" ROC curves with AUC=80%, (values being labels):
$$1: [1, 1, 1, 1, 0, 1]$$ $$2: [0, 1, 0, 0, 0, 0]$$
The resulting curves (1 in blue, 2 in red):

You can derive contingency tables from an ROC curve if you have the number of test instances per class, but not from AUC alone.
