added 5 characters in body
Source Link
Glen_b
  • 290.5k
  • 37
  • 652
  • 1.1k

All participants answered two questions. One question was answered correctly by 85% and the other question was answered correctly by 65%. I am interested in whether the proportion of correct answers is significantly larger for the first than the second question.

That would be a paired test.

Why is wrong to use a two-proportions z test in this case?

Because the independent-sample proportions test relies on ... independence. Specifically, the (normal approximation of the) distribution of the test statistic under the null hypothesis is computed on the basis that the observations are independent.

Does it also depend on the question one would like to answer with the statistical test?

No, at least not for any of the questions that occur to me.

What are the consequences of using the procedure nonetheless (e.g. will the significance values be systematically too high or low)?

If you do it with samples that are paired (and so positively correlated within the pairs), as in your example, then the variance of the difference in proportions will be different from what the independence assumption would suggest.

As a result, your true significance level will be larger than you chose it to be so you'll reject more often (much more often) than you should.

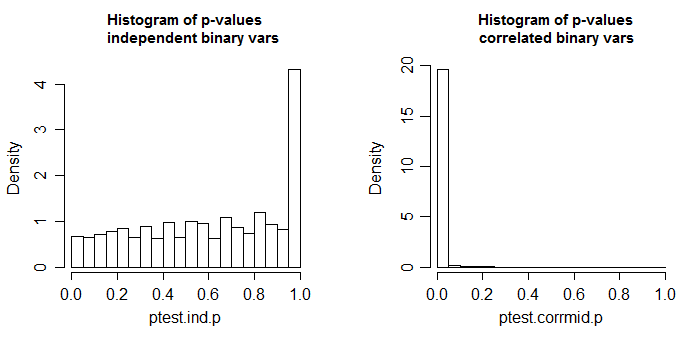
Below is the results of a simulation, first when the two columns are independent, and second when the variables are correlated (to get correlated binary variables I generated correlated standard normals with $\rho=0.6$ and dichotomized them by recording $1$ if they were less than 0.1**; the independent variables were created the same way but from independent normals).

** I chose a $p$ that was not exactly 1/2, in case there was any thought that $p$=1/2 might be a special case
enter image description here

These are 10000 simulations at n=100 for a two-tailed two sample proportions test (here done via a chi-square using R's default settings; the chi-square should be the square of the z-test done with the same settings). The true distribution of the test statistic is discrete and the chi-square (and the corresponding z-test) is approximate. The small spike in the left-side plot is due to that discreteness (and leads to mild conservatism in the test with independent proportions); ideally it should look uniform. In the right hand plot, correlated binaries (as described above) were used. There, about 98% of the tables generated had p-value <0.05. This is when the null hypothesis is true.

A small amount of effect might be tolerable, but this is quite dramatic.

All participants answered two questions. One question was answered correctly by 85% and the other question was answered correctly by 65%. I am interested in whether the proportion of correct answers is significantly larger for the first than the second question.

That would be a paired test.

Why is wrong to use a two-proportions z test in this case?

Because the independent-sample proportions test relies on ... independence. Specifically, the (normal approximation of the) distribution of the test statistic under the null hypothesis is computed on the basis that the observations are independent.

Does it also depend on the question one would like to answer with the statistical test?

No, at least not for any of the questions that occur to me.

What are the consequences of using the procedure nonetheless (e.g. will the significance values be systematically too high or low)?

If you do it with samples that are paired (and so positively correlated within the pairs), as in your example, then the variance of the difference in proportions will be different from what the independence assumption would suggest.

As a result, your significance level will be larger than you chose it to be so you'll reject more often (much more often) than you should.

Below is the results of a simulation, first when the two columns are independent, and second when the variables are correlated (to get correlated binary variables I generated correlated standard normals with $\rho=0.6$ and dichotomized them by recording $1$ if they were less than 0.1**; the independent variables were created the same way but from independent normals).

** I chose a $p$ that was not exactly 1/2, in case there was any thought that $p$=1/2 might be a special case

enter image description here

These are 10000 simulations at n=100 for a two-tailed two sample proportions test (here done via a chi-square using R's default settings; the chi-square should be the square of the z-test done with the same settings). The true distribution of the test statistic is discrete and the chi-square (and the corresponding z-test) is approximate. The small spike in the left-side plot is due to that discreteness (and leads to mild conservatism in the test with independent proportions); ideally it should look uniform. In the right hand plot, correlated binaries (as described above) were used. There, about 98% of the tables generated had p-value <0.05. This is when the null hypothesis is true.

A small amount of effect might be tolerable, but this is quite dramatic.

All participants answered two questions. One question was answered correctly by 85% and the other question was answered correctly by 65%. I am interested in whether the proportion of correct answers is significantly larger for the first than the second question.

That would be a paired test.

Why is wrong to use a two-proportions z test in this case?

Because the independent-sample proportions test relies on ... independence. Specifically, the (normal approximation of the) distribution of the test statistic under the null hypothesis is computed on the basis that the observations are independent.

Does it also depend on the question one would like to answer with the statistical test?

No, at least not for any of the questions that occur to me.

What are the consequences of using the procedure nonetheless (e.g. will the significance values be systematically too high or low)?

If you do it with samples that are paired (and so positively correlated within the pairs), as in your example, then the variance of the difference in proportions will be different from what the independence assumption would suggest.

As a result, your true significance level will be larger than you chose it to be so you'll reject more often (much more often) than you should.

Below is the results of a simulation, first when the two columns are independent, and second when the variables are correlated (to get correlated binary variables I generated correlated standard normals with $\rho=0.6$ and dichotomized them by recording $1$ if they were less than 0.1**; the independent variables were created the same way but from independent normals).

** I chose a $p$ that was not exactly 1/2, in case there was any thought that $p$=1/2 might be a special case

enter image description here

These are 10000 simulations at n=100 for a two-tailed two sample proportions test (here done via a chi-square using R's default settings; the chi-square should be the square of the z-test done with the same settings). The true distribution of the test statistic is discrete and the chi-square (and the corresponding z-test) is approximate. The small spike in the left-side plot is due to that discreteness (and leads to mild conservatism in the test with independent proportions); ideally it should look uniform. In the right hand plot, correlated binaries (as described above) were used. There, about 98% of the tables generated had p-value <0.05. This is when the null hypothesis is true.

A small amount of effect might be tolerable, but this is quite dramatic.

fixes, added simulation results
Source Link
Glen_b
  • 290.5k
  • 37
  • 652
  • 1.1k

All participants answered two questions. One question was answered correctly by 85% and the other question was answered correctly by 65%. I am interested in whether the proportion of correct answers is significantly larger for the first than the second question.

That would be a paired test.

Why is wrong to use a two-proportions z test in this case?

Because the independent-sample proportions test relies on ... independence. Specifically, the (normal approximation of the) distribution of the test statistic under the null hypothesis is computed on the basis that the observations are independent.

Does it also depend on the question one would like to answer with the statistical test?

No, at least not for any of the questions that occur to me.

What are the consequences of using the procedure nonetheless (e.g. will the significance values be systematically too high or low)?

If you do it with samples that are paired (and so positively correlated within the pairs), as in your example, then the variance of the difference in proportions will be lower thandifferent from what the independence assumption would suggest. Your

As a result, your significance level will be smallerlarger than you chose it to be, and so you'll fail to reject thingsmore often (much more often) than you could rejectshould.

Below is the results of a simulation, first when the two columns are independent, and second when the variables are correlated (to get correlated binary variables I generated correlated standard normals with $\rho=0.6$ and dichotomized them by recording $1$ if they were less than 0.1**; the independent variables were created the same way but from independent normals).

** I chose a $p$ that was not exactly 1/2, in case there was any thought that $p$=1/2 might be a special case

enter image description here

These are 10000 simulations at n=100 for a two-tailed two sample proportions test (here done via a chi-square using R's default settings; the chi-square should be the square of the z-test done with the same settings). The true distribution of the test statistic is discrete and the chi-square (and the corresponding z-test) is approximate. The small spike in the left-side plot is due to that discreteness (and leads to mild conservatism in the test with independent proportions); ideally it should look uniform. In the right hand plot, correlated binaries (as described above) were used. There, about 98% of the tables generated had p-value <0.05. This is when the null hypothesis is true.

A small amount of effect might be tolerable, but this is quite dramatic.

All participants answered two questions. One question was answered correctly by 85% and the other question was answered correctly by 65%. I am interested in whether the proportion of correct answers is significantly larger for the first than the second question.

That would be a paired test.

Why is wrong to use a two-proportions z test in this case?

Because the independent-sample proportions test relies on ... independence. Specifically, the (normal approximation of the) distribution of the test statistic under the null hypothesis is computed on the basis that the observations are independent.

Does it also depend on the question one would like to answer with the statistical test?

No, at least not for any of the questions that occur to me.

What are the consequences of using the procedure nonetheless (e.g. will the significance values be systematically too high or low)?

If you do it with samples that are paired (and so positively correlated within the pairs), as in your example, then the variance of the difference in proportions will be lower than the independence assumption would suggest. Your significance level will be smaller than you chose it to be, and you'll fail to reject things you could reject.

All participants answered two questions. One question was answered correctly by 85% and the other question was answered correctly by 65%. I am interested in whether the proportion of correct answers is significantly larger for the first than the second question.

That would be a paired test.

Why is wrong to use a two-proportions z test in this case?

Because the independent-sample proportions test relies on ... independence. Specifically, the (normal approximation of the) distribution of the test statistic under the null hypothesis is computed on the basis that the observations are independent.

Does it also depend on the question one would like to answer with the statistical test?

No, at least not for any of the questions that occur to me.

What are the consequences of using the procedure nonetheless (e.g. will the significance values be systematically too high or low)?

If you do it with samples that are paired (and so positively correlated within the pairs), as in your example, then the variance of the difference in proportions will be different from what the independence assumption would suggest.

As a result, your significance level will be larger than you chose it to be so you'll reject more often (much more often) than you should.

Below is the results of a simulation, first when the two columns are independent, and second when the variables are correlated (to get correlated binary variables I generated correlated standard normals with $\rho=0.6$ and dichotomized them by recording $1$ if they were less than 0.1**; the independent variables were created the same way but from independent normals).

** I chose a $p$ that was not exactly 1/2, in case there was any thought that $p$=1/2 might be a special case

enter image description here

These are 10000 simulations at n=100 for a two-tailed two sample proportions test (here done via a chi-square using R's default settings; the chi-square should be the square of the z-test done with the same settings). The true distribution of the test statistic is discrete and the chi-square (and the corresponding z-test) is approximate. The small spike in the left-side plot is due to that discreteness (and leads to mild conservatism in the test with independent proportions); ideally it should look uniform. In the right hand plot, correlated binaries (as described above) were used. There, about 98% of the tables generated had p-value <0.05. This is when the null hypothesis is true.

A small amount of effect might be tolerable, but this is quite dramatic.

Source Link
Glen_b
  • 290.5k
  • 37
  • 652
  • 1.1k

All participants answered two questions. One question was answered correctly by 85% and the other question was answered correctly by 65%. I am interested in whether the proportion of correct answers is significantly larger for the first than the second question.

That would be a paired test.

Why is wrong to use a two-proportions z test in this case?

Because the independent-sample proportions test relies on ... independence. Specifically, the (normal approximation of the) distribution of the test statistic under the null hypothesis is computed on the basis that the observations are independent.

Does it also depend on the question one would like to answer with the statistical test?

No, at least not for any of the questions that occur to me.

What are the consequences of using the procedure nonetheless (e.g. will the significance values be systematically too high or low)?

If you do it with samples that are paired (and so positively correlated within the pairs), as in your example, then the variance of the difference in proportions will be lower than the independence assumption would suggest. Your significance level will be smaller than you chose it to be, and you'll fail to reject things you could reject.