I'm trying to generate a bivariate random sample of the t-copula (using rho = 0.8), without using the "copula" package and its function "rCopula" with method "tCopula". I'm using the following R-code:
N <- 10000
R <- array(c(1,0.8,0.8,1), dim=c(2,2))
L <- t(chol(R))
Z <- rbind(rnorm(N),rnorm(N))
X <- L%*%Z
df <- 2
W <- df/rchisq(N,df)
Y <- sqrt(W)*X
plot(Y[1,],Y[2,])
U <- pt(Y,df)
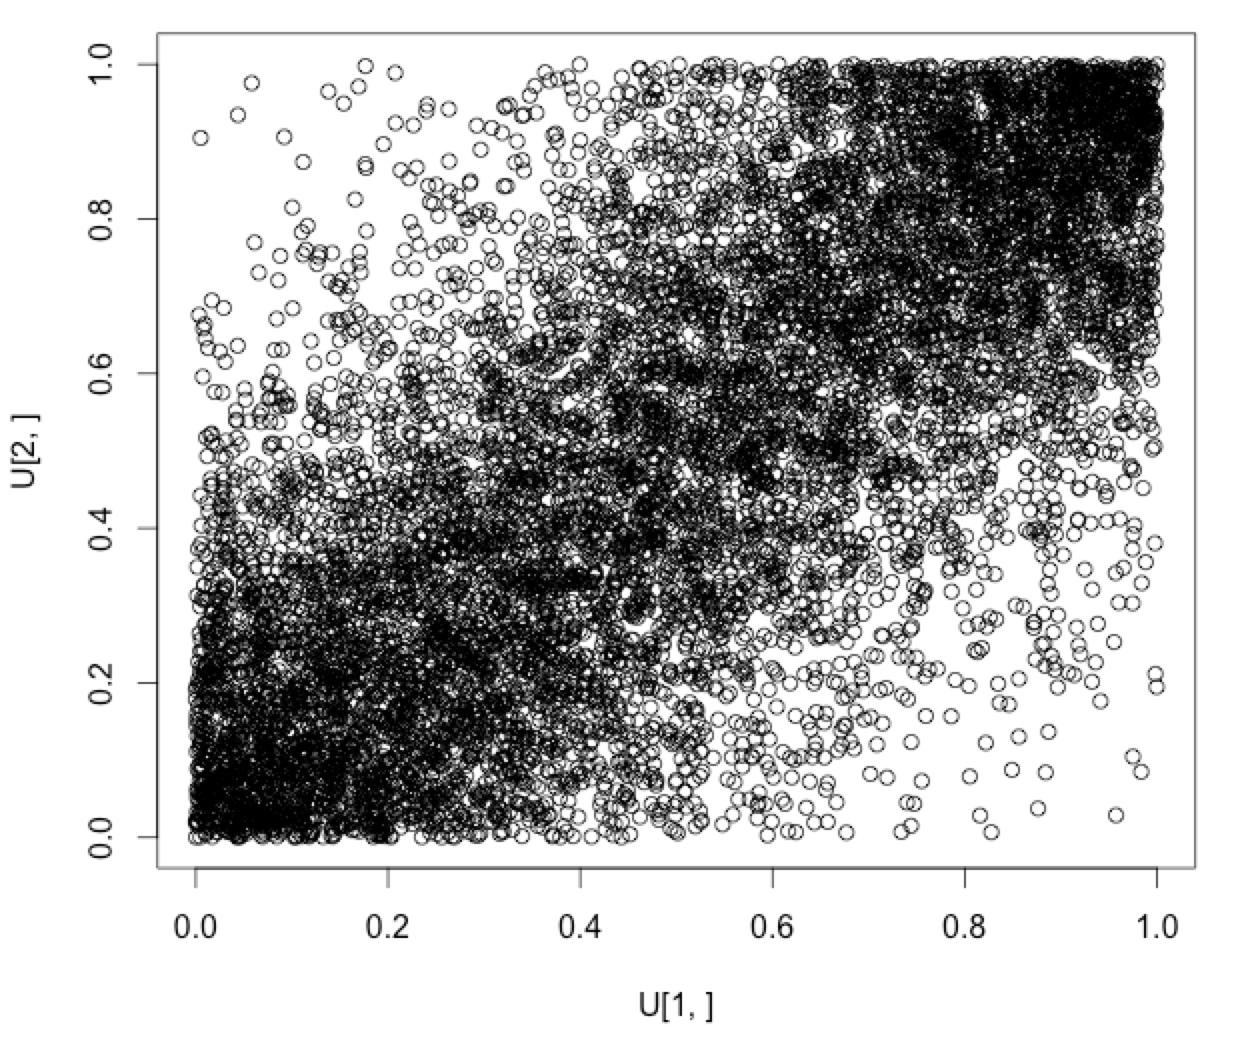
plot(U[1,],U[2,])
But the plot does not look like random points from a t-copula:
![enter image description here][1] [1]: https://i.sstatic.net/3VBzw.jpg
DoesDoes anyone know if I'm making a conceptual error or a mistake in the code?
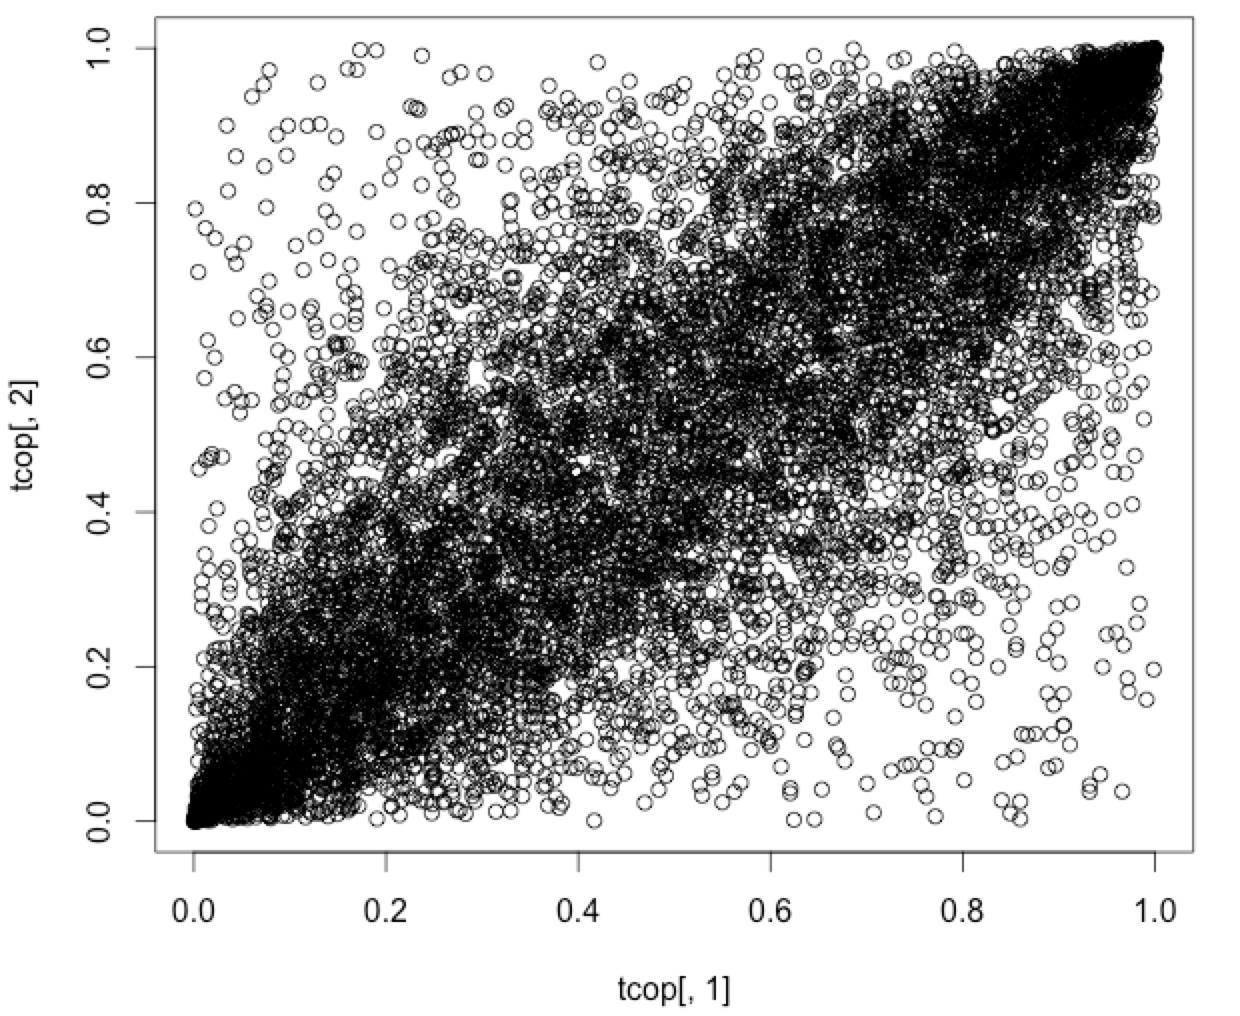
It should look more like this: (generated using the copula package and its inbuilt functions)

