added 962 characters in body
Source Link
csgillespie
  • 12.9k
  • 9
  • 62
  • 91

I've used the Mfuzz in R for clustering time-course microarray data sets. Mfuzz uses "soft-clustering". Basically, individuals can appear in more than one group.

As @Andy points out in the comment, the original paper uses CTN data. However, I suspect that it should work OK for your discrete data. Especially since you are just exploring the data set. Here's somea quick example output to give you an idea of what it doesin R:

##It's a bioconductor package
library(Mfuzz)
library(Biobase)

## Simulate some data
## 6 time points and 90 individuals
tps = 6;cases = 90
d = rpois(tps*cases, 1)  ##Poisson distribution with mean 1
m = matrix(d, ncol=tps, nrow=cases)

##First 30 individuals have increasing trends
m[1:30,] = t(apply(m[1:30,], 1, cumsum))

##Next 30 have decreasing trends
##A bit hacky, sorry
m[31:60,] = t(apply(t(apply(m[31:60,], 1, cumsum)), 1, rev))

##Last 30 individuals have random numbers from a Po(1)

##Create an expressionSet object
tmp_expr = new('ExpressionSet', exprs=m)

##Specify c=3 clusters
cl = mfuzz(tmp_expr, c=3, m=1.25)
mfuzz.plot(tmp_expr,cl=cl, mfrow=c(2, 2))

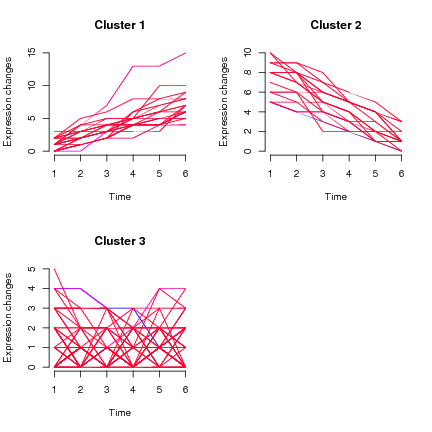
Example mfuzz output Gives the following plot:

Mfuzz clustering

I've used the Mfuzz in R for clustering time-course microarray data sets. Mfuzz uses "soft-clustering". Basically, individuals can appear in more than one group. Here's some example output to give you an idea of what it does:

Example mfuzz output

I've used the Mfuzz in R for clustering time-course microarray data sets. Mfuzz uses "soft-clustering". Basically, individuals can appear in more than one group.

As @Andy points out in the comment, the original paper uses CTN data. However, I suspect that it should work OK for your discrete data. Especially since you are just exploring the data set. Here's a quick example in R:

##It's a bioconductor package
library(Mfuzz)
library(Biobase)

## Simulate some data
## 6 time points and 90 individuals
tps = 6;cases = 90
d = rpois(tps*cases, 1)  ##Poisson distribution with mean 1
m = matrix(d, ncol=tps, nrow=cases)

##First 30 individuals have increasing trends
m[1:30,] = t(apply(m[1:30,], 1, cumsum))

##Next 30 have decreasing trends
##A bit hacky, sorry
m[31:60,] = t(apply(t(apply(m[31:60,], 1, cumsum)), 1, rev))

##Last 30 individuals have random numbers from a Po(1)

##Create an expressionSet object
tmp_expr = new('ExpressionSet', exprs=m)

##Specify c=3 clusters
cl = mfuzz(tmp_expr, c=3, m=1.25)
mfuzz.plot(tmp_expr,cl=cl, mfrow=c(2, 2))

Gives the following plot:

Mfuzz clustering

Source Link
csgillespie
  • 12.9k
  • 9
  • 62
  • 91

I've used the Mfuzz in R for clustering time-course microarray data sets. Mfuzz uses "soft-clustering". Basically, individuals can appear in more than one group. Here's some example output to give you an idea of what it does:

Example mfuzz output