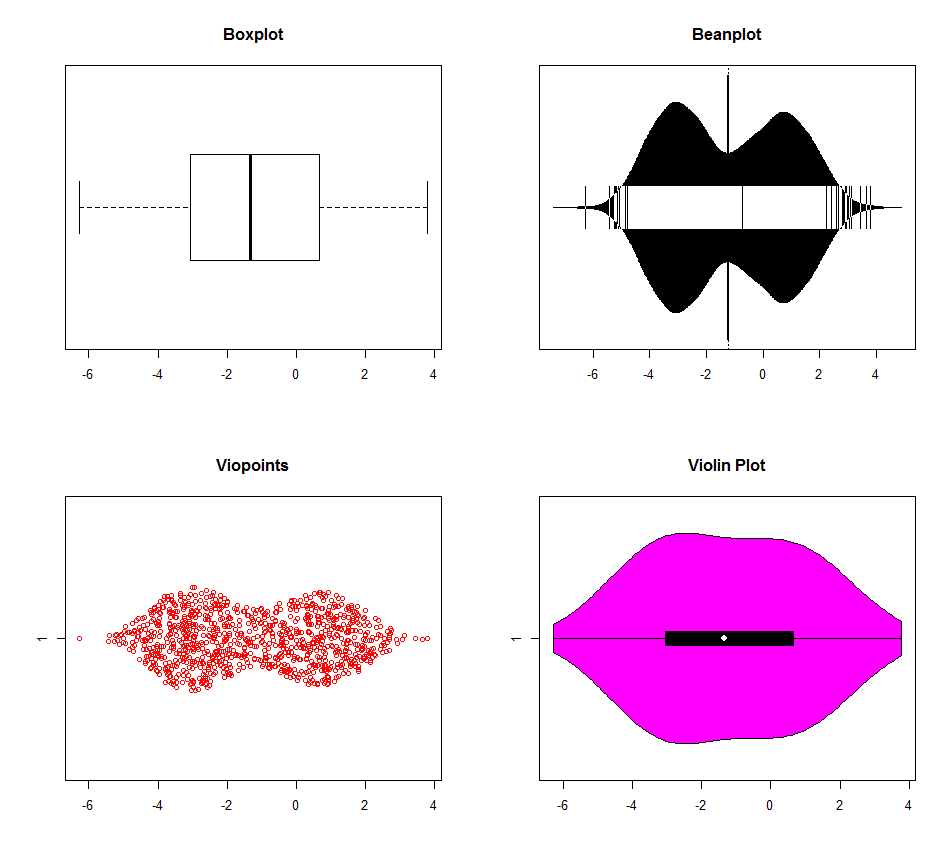
There are multiple options for detecting multimodality with R. Data for the below charts was generated with three modes (-3,0,1,-3). The boxplot is clearly outperformed by the others (the violin plot looks like it has different default kernalkernel density settings), but none really distinguish between the 0 and 1 modes. There are really few reasons to use boxplots anymore in the computer age. Why throw out information?

dat<dat <- c(rnorm(200500,0 -3, 1), rnorm(300200,1 0, 1), rnorm(500300,-3 1, 1))

par(mfrow=c(2, 2))
boxplot(dat, horizontal=Thorizontal=TRUE, main="Boxplot")

require(beanplot)
beanplot(dat, horizontal=Thorizontal=TRUE, main="Beanplot")

require(viopoints)
viopoints(dat, horizontal=Thorizontal=TRUE, main="Viopoints")

require(vioplot)
vioplot(dat, horizontal=Thorizontal=TRUE)
title("Violin Plot")
