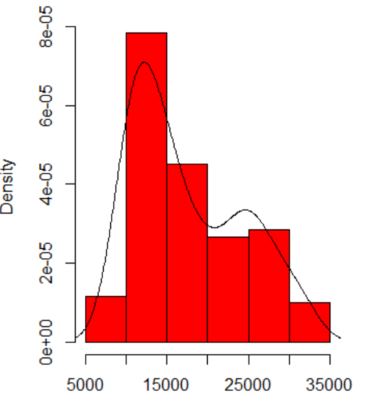
When I plot thea histogram of my data, Itit has two peaks:

Does that mean a potential multi-modal distribution? I runran the dip.test in R (library(diptest)), and the output is:
D = 0.0275, p-value = 0.7913
I can conclude that my data have a multi-modal distribution?
DATA
10346 13698 13894 19854 28066 26620 27066 16658  9221 13578 11483 10390 11126 13487
15851 16116 24102 30892 25081 14067 10433 15591  8639 10345 10639 15796 14507 21289
25444 26149 23612 19671 12447 13535 10667 11255  8442 11546 15958 21058 28088 23827
30707 19653 12791 13463 11465 12326 12277 12769 18341 19140 24590 28277 22694 15489
11070 11002 11579  9834  9364 15128 15147 18499 25134 32116 24475 21952 10272 15404
13079 10633 10761 13714 16073 23335 29822 26800 31489 19780 12238 15318  9646 11786
10906 13056 17599 22524 25057 28809 27880 19912 12319 18240 11934 10290 11304 16092
15911 24671 31081 27716 25388 22665 10603 14409 10736  9651 12533 17546 16863 23598
25867 31774 24216 20448 12548 15129 11687 11581
