I am working on an alogorithm in R to automatize a monthly forecast calculation. I am using, among others, the ets() function from the forecast package to calculate forecast. It is working very well.
Unfortunately, for some specific time series, the result I get is weird.
Please, find below the code i am using :
train_ts<- ts(values, frequency=12)
fit2<-ets(train_ts, model="ZZZ", damped=TRUE, alpha=NULL, beta=NULL, gamma=NULL,
            phi=NULL, additive.only=FALSE, lambda=TRUE,
            lower=c(0.0001,0.0001,0.0001,0.8),upper=c(0.9999,0.9999,0.9999,0.98),
            opt.crit=c("lik","amse","mse","sigma","mae"), nmse=3,
            bounds=c("both","usual","admissible"), ic=c("aicc","aic","bic"),
            restrict=TRUE)
ets <- forecast(fit2,h=forecasthorizon,method ='ets')
Please, you will find below the concerned history data set :
 values <- c(27, 27, 7, 24, 39, 40, 24, 45, 36, 37, 31, 47, 16, 24, 6, 21,
35, 36, 21, 40, 32, 33, 27, 42, 14, 21, 5, 19, 31, 32, 19, 36,
29, 29, 24, 42, 15, 24, 21)
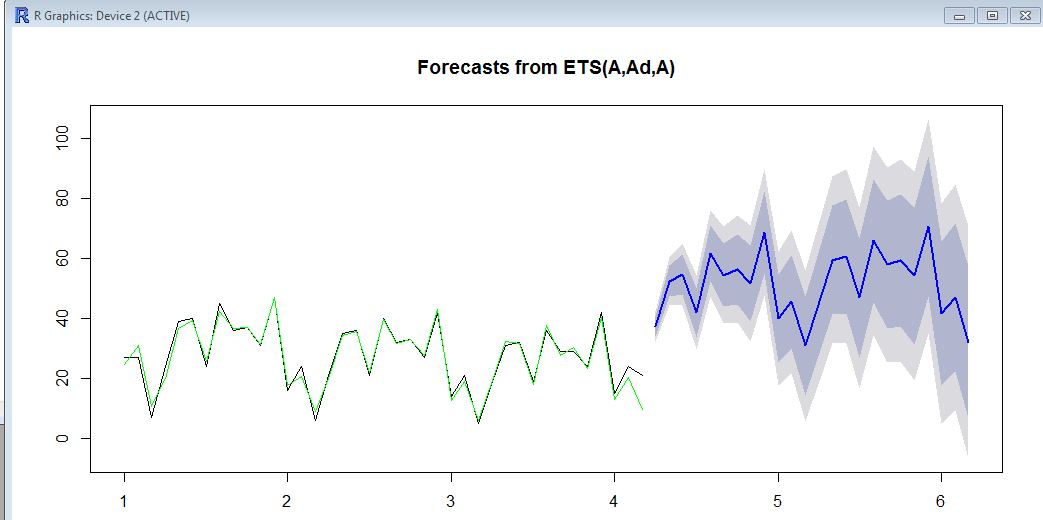
Here, on the graph, you will see the historical data (black), the fitted value (green) and the forecast(blue). The forecast is definitely not in lines with the fitted value.
Do you have any idea on how to "bound" the forecat to be "in line" with the historical sales? Thank you very very much for your kind help.
Best regards.
