added 32 characters in body
Source Link
forecaster
  • 8.7k
  • 10
  • 51
  • 87

This is textbook case of having outliers at the end of the series and its unintended consequences. The problem with your data is that the last two points are outliers, you might want to identify and treat outliers before you run the forecasting algorithms. I'll update my answer and analysis later today on some strategies to identify outliers. Below is the quick update.

When I rerun ets with last two data points removed, I get a reasonable forecast. Please see below:

values.clean <- c(27, 27, 7, 24, 39, 40, 24, 45, 36, 37, 31, 47, 16, 24, 6, 21, 
                  35, 36, 21, 40, 32, 33, 27, 42, 14, 21, 5, 19, 31, 32, 19, 36, 
                  29, 29, 24, 42, 15)## Last two points removed

train_ts.clean<- ts(values.clean, frequency=12)
fit2.clean<-ets(train_ts.clean)  
ets.f.clean <- forecast(fit2.clean,h=24)
plot(ets.f.clean)
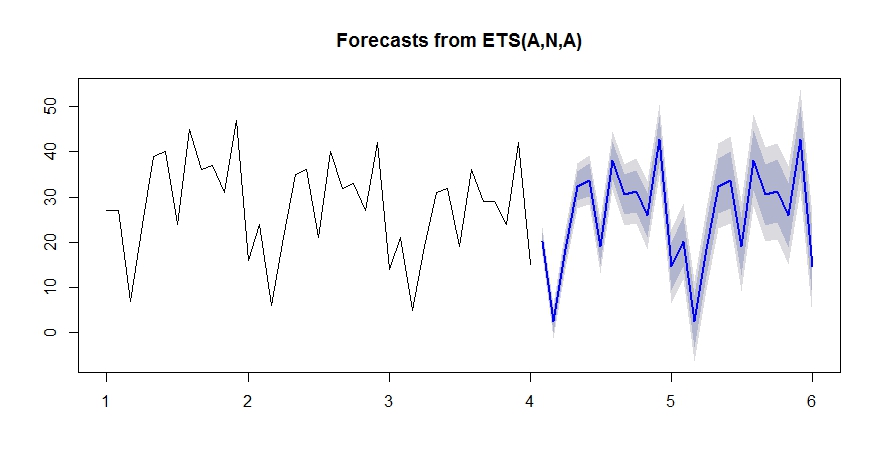
enter image description here

This is textbook case of having outliers at the end of the series. The problem with your data is that the last two points are outliers, you might want to identify and treat outliers before you run the forecasting algorithms. I'll update my answer and analysis later today on some strategies to identify outliers. Below is the quick update.

When I rerun ets with last two data points removed, I get a reasonable forecast. Please see below:

values.clean <- c(27, 27, 7, 24, 39, 40, 24, 45, 36, 37, 31, 47, 16, 24, 6, 21, 
                  35, 36, 21, 40, 32, 33, 27, 42, 14, 21, 5, 19, 31, 32, 19, 36, 
                  29, 29, 24, 42, 15)## Last two points removed

train_ts.clean<- ts(values.clean, frequency=12)
fit2.clean<-ets(train_ts.clean)  
ets.f.clean <- forecast(fit2.clean,h=24)
plot(ets.f.clean)

enter image description here

This is textbook case of having outliers at the end of the series and its unintended consequences. The problem with your data is that the last two points are outliers, you might want to identify and treat outliers before you run the forecasting algorithms. I'll update my answer and analysis later today on some strategies to identify outliers. Below is the quick update.

When I rerun ets with last two data points removed, I get a reasonable forecast. Please see below:

values.clean <- c(27, 27, 7, 24, 39, 40, 24, 45, 36, 37, 31, 47, 16, 24, 6, 21, 
                  35, 36, 21, 40, 32, 33, 27, 42, 14, 21, 5, 19, 31, 32, 19, 36, 
                  29, 29, 24, 42, 15)## Last two points removed

train_ts.clean<- ts(values.clean, frequency=12)
fit2.clean<-ets(train_ts.clean)  
ets.f.clean <- forecast(fit2.clean,h=24)
plot(ets.f.clean)

enter image description here

Source Link
forecaster
  • 8.7k
  • 10
  • 51
  • 87

This is textbook case of having outliers at the end of the series. The problem with your data is that the last two points are outliers, you might want to identify and treat outliers before you run the forecasting algorithms. I'll update my answer and analysis later today on some strategies to identify outliers. Below is the quick update.

When I rerun ets with last two data points removed, I get a reasonable forecast. Please see below:

values.clean <- c(27, 27, 7, 24, 39, 40, 24, 45, 36, 37, 31, 47, 16, 24, 6, 21, 
                  35, 36, 21, 40, 32, 33, 27, 42, 14, 21, 5, 19, 31, 32, 19, 36, 
                  29, 29, 24, 42, 15)## Last two points removed

train_ts.clean<- ts(values.clean, frequency=12)
fit2.clean<-ets(train_ts.clean)  
ets.f.clean <- forecast(fit2.clean,h=24)
plot(ets.f.clean)

enter image description here