Tweeted twitter.com/StackStats/status/651386667199254529
added tag; formatted; light editing; removed thanks
Source Link
gung - Reinstate Monica
  • 147.5k
  • 89
  • 406
  • 717

meaning Meaning of y axis in Random Forest partial dependence plot

I am using the RandomForestRandomForest R package and am confused at how to interpret the values of the Y-axis in their partial dependence plots. Help docs state that the plot is a "graphical depiction of the marginal effect of a variable on the class probability." However, I am still confused as to what exactly the y-axis represents. Particularly, what do the negative values mean? What does it mean to have a negative influence on accurately predicting the class? And what is the most important feature from these figures, is it the max value, the shape of the trend etc? Can you compare the partial plots with partial plots of other variables? and how might these plots compare with response curves created in Maxent (a distribution modeling software)? thanks for any help!

  • Particularly, what do the negative values mean?
  • What does it mean to have a negative influence on accurately predicting the class?
  • And what is the most important feature from these figures, is it the max value, the shape of the trend etc?
  • Can you compare the partial plots with partial plots of other variables?
  • How might these plots compare with response curves created in Maxent (a distribution modeling software)?
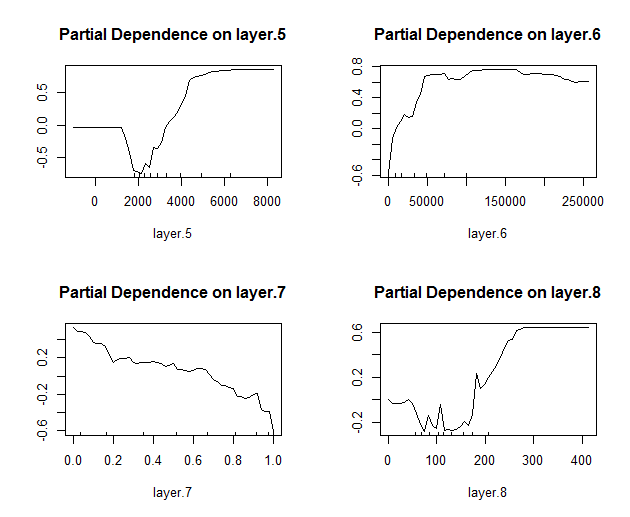
Some example partial dependence plots

meaning of y axis in Random Forest partial dependence plot

I am using the RandomForest R package and am confused at how to interpret the values of the Y-axis in their partial dependence plots. Help docs state that the plot is a "graphical depiction of the marginal effect of a variable on the class probability." However, I am still confused as to what exactly the y-axis represents. Particularly, what do the negative values mean? What does it mean to have a negative influence on accurately predicting the class? And what is the most important feature from these figures, is it the max value, the shape of the trend etc? Can you compare the partial plots with partial plots of other variables? and how might these plots compare with response curves created in Maxent (a distribution modeling software)? thanks for any help! Some example partial dependence plots

Meaning of y axis in Random Forest partial dependence plot

I am using the RandomForest R package and am confused at how to interpret the values of the Y-axis in their partial dependence plots. Help docs state that the plot is a "graphical depiction of the marginal effect of a variable on the class probability." However, I am still confused as to what exactly the y-axis represents.

  • Particularly, what do the negative values mean?
  • What does it mean to have a negative influence on accurately predicting the class?
  • And what is the most important feature from these figures, is it the max value, the shape of the trend etc?
  • Can you compare the partial plots with partial plots of other variables?
  • How might these plots compare with response curves created in Maxent (a distribution modeling software)?

Some example partial dependence plots

Source Link
jacobsap
  • 181
  • 1
  • 1
  • 3

meaning of y axis in Random Forest partial dependence plot

I am using the RandomForest R package and am confused at how to interpret the values of the Y-axis in their partial dependence plots. Help docs state that the plot is a "graphical depiction of the marginal effect of a variable on the class probability." However, I am still confused as to what exactly the y-axis represents. Particularly, what do the negative values mean? What does it mean to have a negative influence on accurately predicting the class? And what is the most important feature from these figures, is it the max value, the shape of the trend etc? Can you compare the partial plots with partial plots of other variables? and how might these plots compare with response curves created in Maxent (a distribution modeling software)? thanks for any help! Some example partial dependence plots