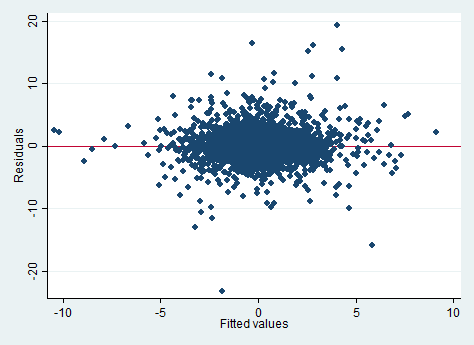
I am working on a linear regression model and I am not sure how to interpret the following residual vs fitted values plot.

For all I know residuals are supposed to fluctuate randomly around 0 which I would say is what my data does more or less (at least there is no apparent trend in one direction or the other).
However might it be a problem that so many of my data points are clustered around the centre? Or that I got too many outliers?
I know that I got quite a large number of data points (3,632) which adds to the clustering but shouldn't the points be more spread out?
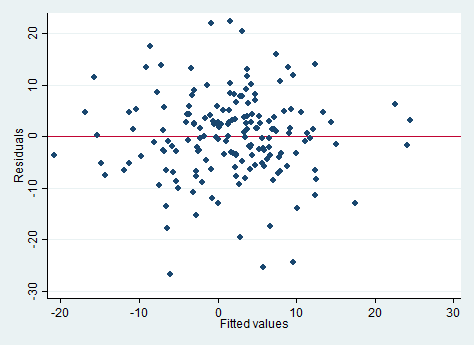
I use daily returns for my regression but I could also use monthly data which would look like this.

Thanks for your help!
