I am trying to perform a clustering analysis for a csv file with 50k+ rows, 10 columns. I tried k-mean, hierarchical and model based clustering methods. Only k-mean works because of the large data set. However, k-mean does not show obvious differentiations between clusters. So I am wondering is there any other way to better perform clustering analysis? Thanks in advanced!

The data looks like this

Revenue  Employee  Longitude Latitude  LocalEmployee BooleanQuestions ...
1000     100       xxxx      xxxx      10
...                                                                   ...

Here is part of my code:

mydata <- scale(mydata)
wss <- (nrow(mydata)-1)*sum(apply(mydata,2,var))
for(i in 2:15)wss[i]<- sum(fit=kmeans(mydata,centers=i,15)$withinss)
plot(1:15,wss,type="b",main="15 clusters",xlab="no. of cluster",ylab="with clsuter sum of squares")

fit <- kmeans(mydata,7)
clusplot(mydata, fit$cluster, color=TRUE, shade=TRUE, labels=2, lines=0)
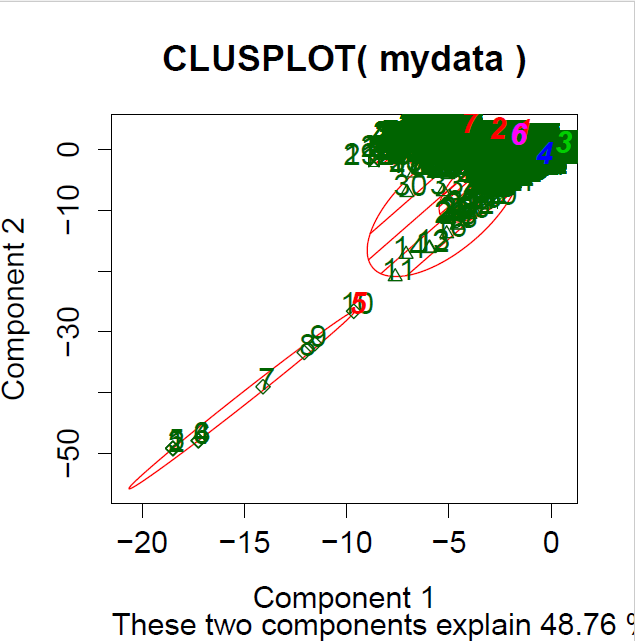
enter image description here

I am trying to perform a clustering analysis for a csv file with 50k+ rows, 10 columns. I tried k-mean, hierarchical and model based clustering methods. Only k-mean works because of the large data set. However, k-mean does not show obvious differentiations between clusters. So I am wondering is there any other way to better perform clustering analysis? Thanks in advanced!

The data looks like this

Revenue  Employee  Longitude Latitude  LocalEmployee BooleanQuestions ...
1000     100       xxxx      xxxx      10
...                                                                   ...

Here is part of my code:

mydata <- scale(mydata)
wss <- (nrow(mydata)-1)*sum(apply(mydata,2,var))
for(i in 2:15)wss[i]<- sum(fit=kmeans(mydata,centers=i,15)$withinss)
plot(1:15,wss,type="b",main="15 clusters",xlab="no. of cluster",ylab="with clsuter sum of squares")

fit <- kmeans(mydata,7)
clusplot(mydata, fit$cluster, color=TRUE, shade=TRUE, labels=2, lines=0)

enter image description here

I am trying to perform a clustering analysis for a csv file with 50k+ rows, 10 columns. I tried k-mean, hierarchical and model based clustering methods. Only k-mean works because of the large data set. However, k-mean does not show obvious differentiations between clusters. So I am wondering is there any other way to better perform clustering analysis?

The data looks like this

Revenue  Employee  Longitude Latitude  LocalEmployee BooleanQuestions ...
1000     100       xxxx      xxxx      10
...                                                                   ...

Here is part of my code:

mydata <- scale(mydata)
wss <- (nrow(mydata)-1)*sum(apply(mydata,2,var))
for(i in 2:15)wss[i]<- sum(fit=kmeans(mydata,centers=i,15)$withinss)
plot(1:15,wss,type="b",main="15 clusters",xlab="no. of cluster",ylab="with clsuter sum of squares")

fit <- kmeans(mydata,7)
clusplot(mydata, fit$cluster, color=TRUE, shade=TRUE, labels=2, lines=0)

enter image description here

Source Link
xgzs
  • 21
  • 1
  • 2

Clustering Analysis for large data in R

I am trying to perform a clustering analysis for a csv file with 50k+ rows, 10 columns. I tried k-mean, hierarchical and model based clustering methods. Only k-mean works because of the large data set. However, k-mean does not show obvious differentiations between clusters. So I am wondering is there any other way to better perform clustering analysis? Thanks in advanced!

The data looks like this

Revenue  Employee  Longitude Latitude  LocalEmployee BooleanQuestions ...
1000     100       xxxx      xxxx      10
...                                                                   ...

Here is part of my code:

mydata <- scale(mydata)
wss <- (nrow(mydata)-1)*sum(apply(mydata,2,var))
for(i in 2:15)wss[i]<- sum(fit=kmeans(mydata,centers=i,15)$withinss)
plot(1:15,wss,type="b",main="15 clusters",xlab="no. of cluster",ylab="with clsuter sum of squares")

fit <- kmeans(mydata,7)
clusplot(mydata, fit$cluster, color=TRUE, shade=TRUE, labels=2, lines=0)

enter image description here