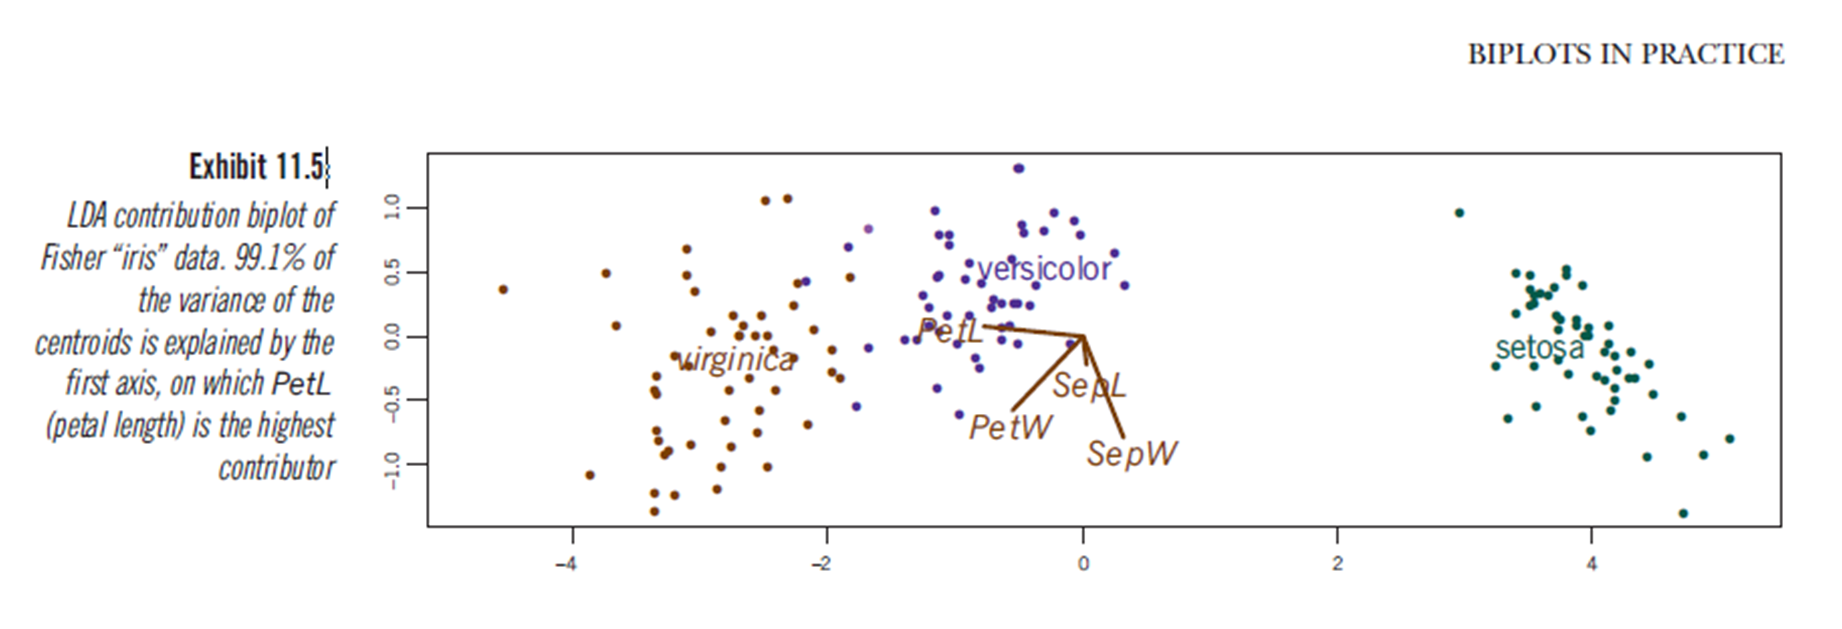
My understanding is that biplots of linear discriminant analyses can be done, it is implemented in fact in R packages ggbiplot and ggord and another function to do it is posted in this StackOverflow threadthis StackOverflow thread.
Also the book "Biplots in practice" by M. Greenacre has one chapter (chapter 11, see pdf) on it and in Figure 11.5 it shows a biplot of a linear discriminant analysis of the iris dataset:

