added 94 characters in body
Source Link
IrishStat
  • 30k
  • 5
  • 36
  • 60

The following not only answers the OP's question about a data set that requires more than a simple OLS solution BUT also answers more general questions (unasked by the OP) regarding other possible deficiencies of OLS When applied to time series data. I use AUTOBOX here ( a piece of software I have helped develop) but one could use any software that can incorporate user-specified predictors while identifying an appropriatw arima structure and the need for any necessary unspecified dummy variables reflecting unspecified deterministic changes in the data. For a simpler problem set (less complicated solution required) just use the first 68 values.

TIME SERIES DATA

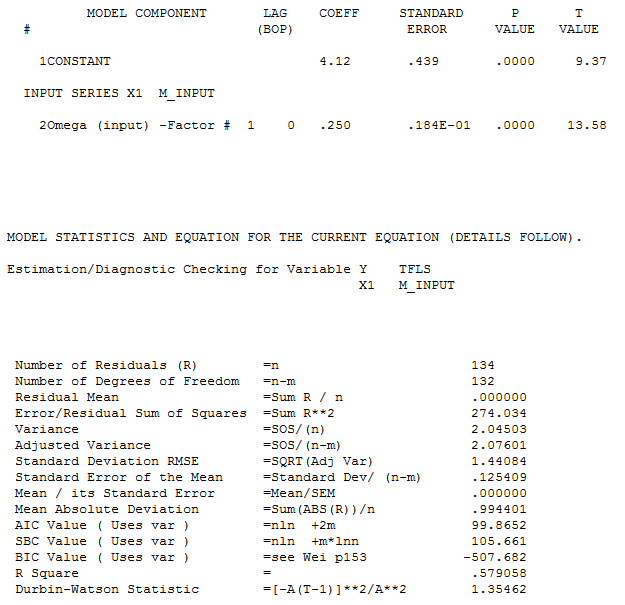
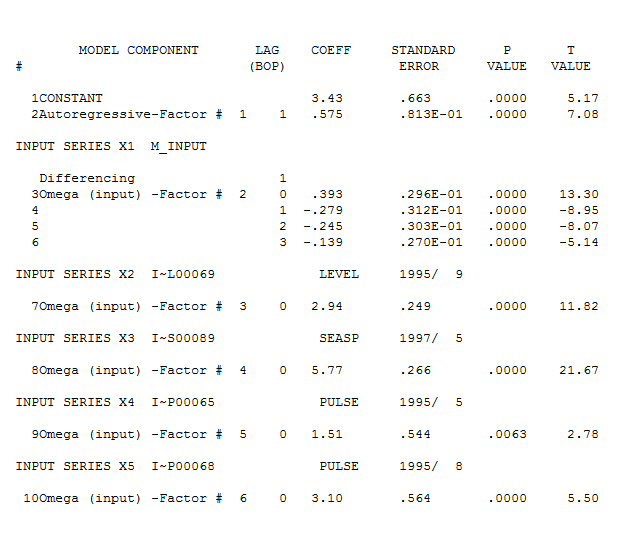
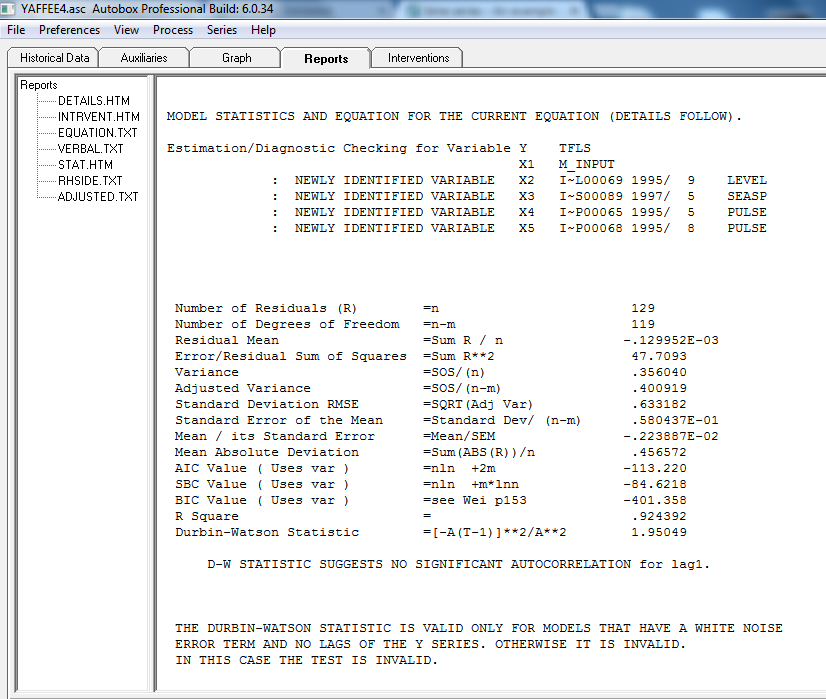
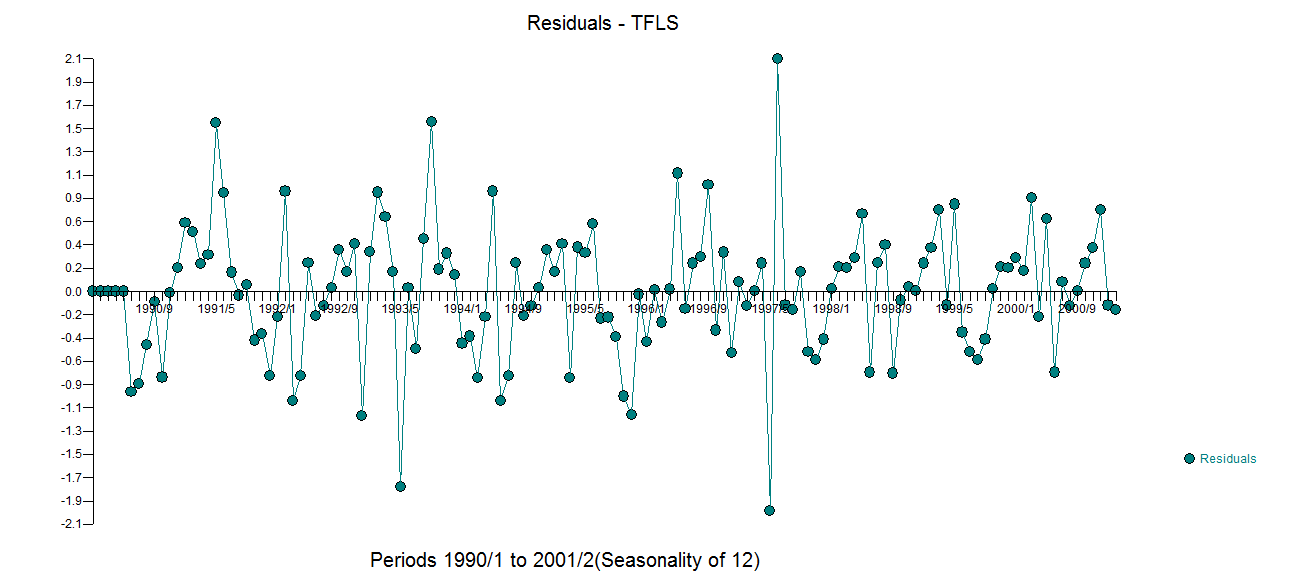
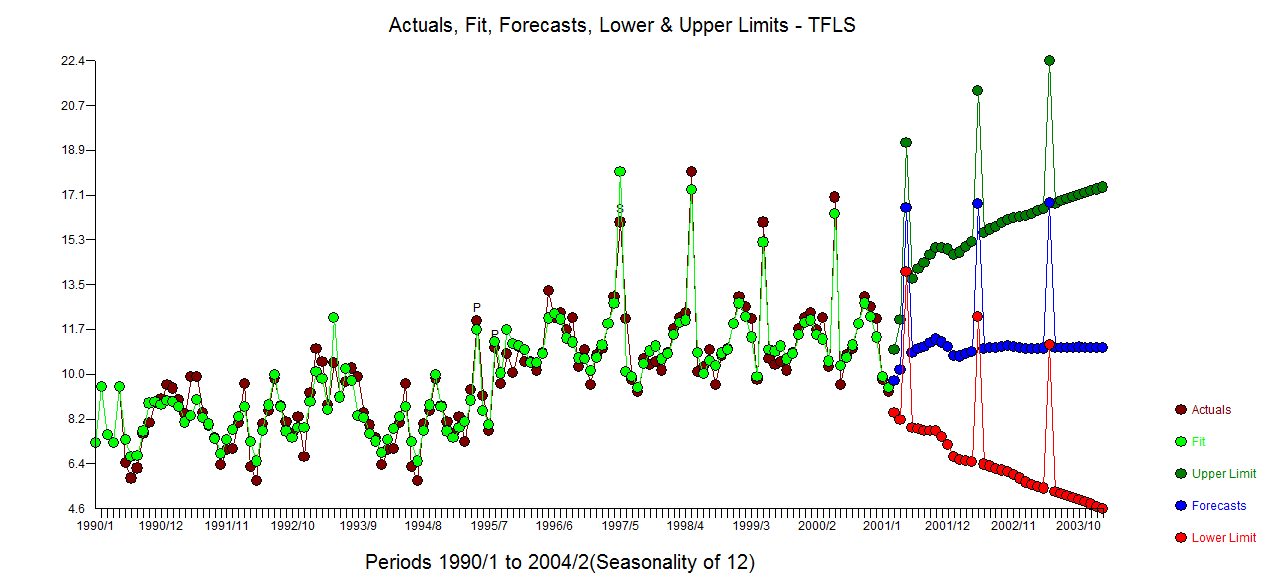
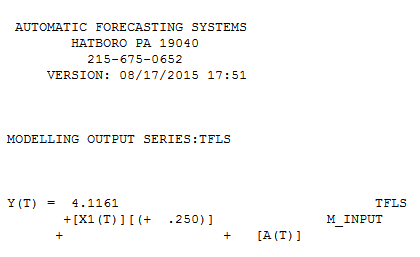
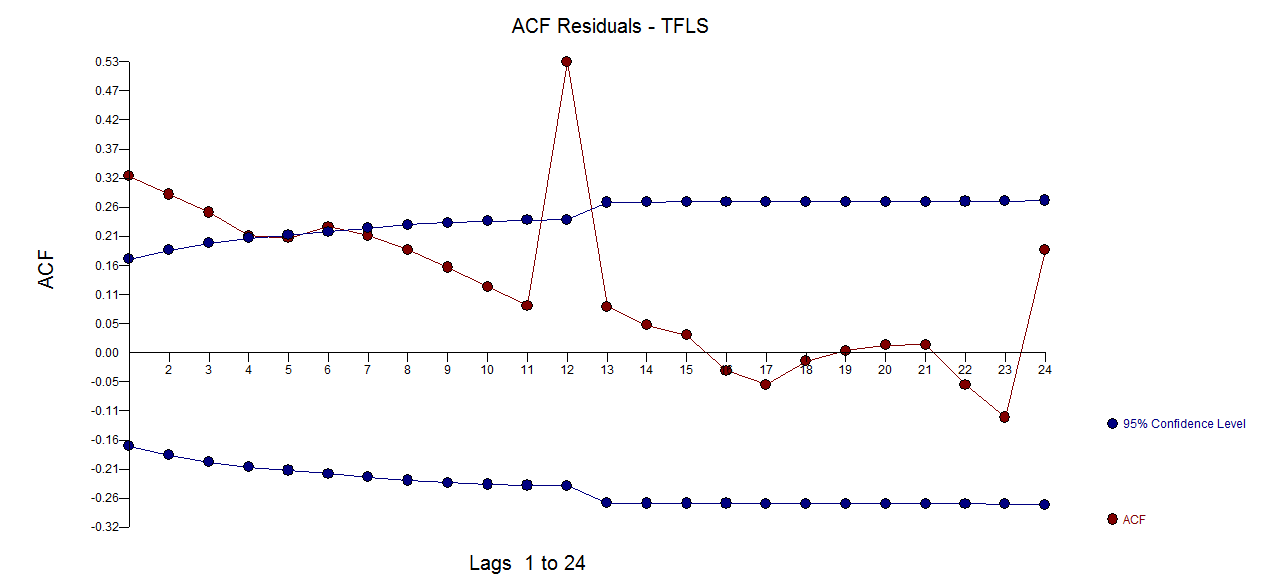
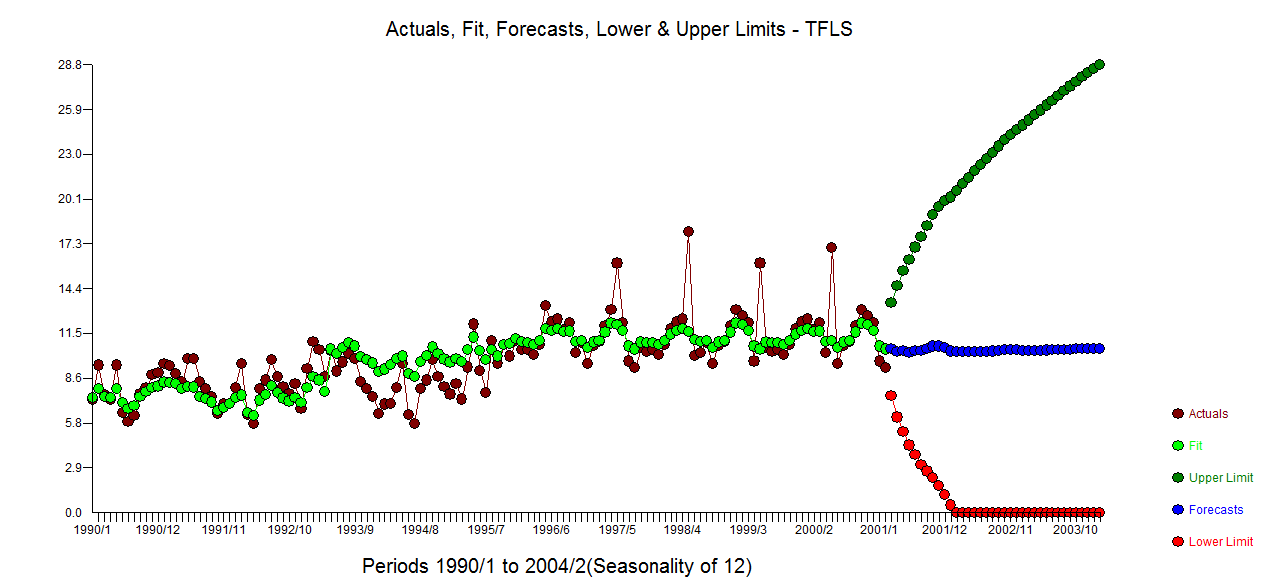
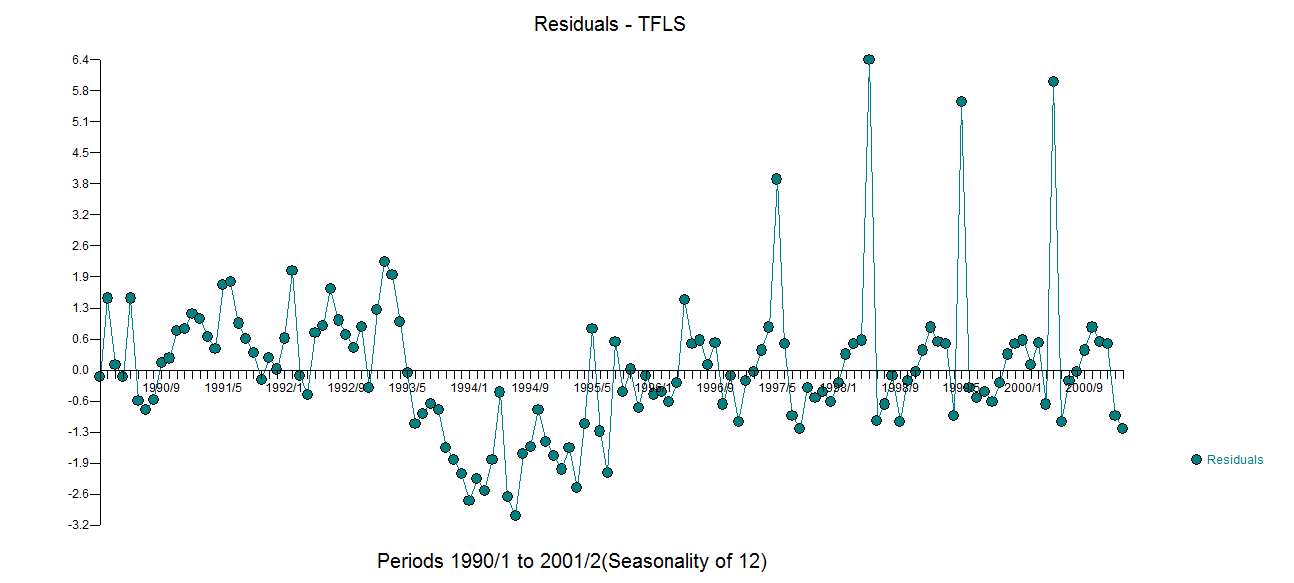
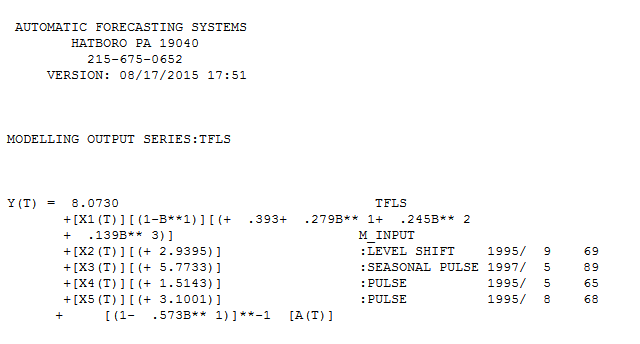
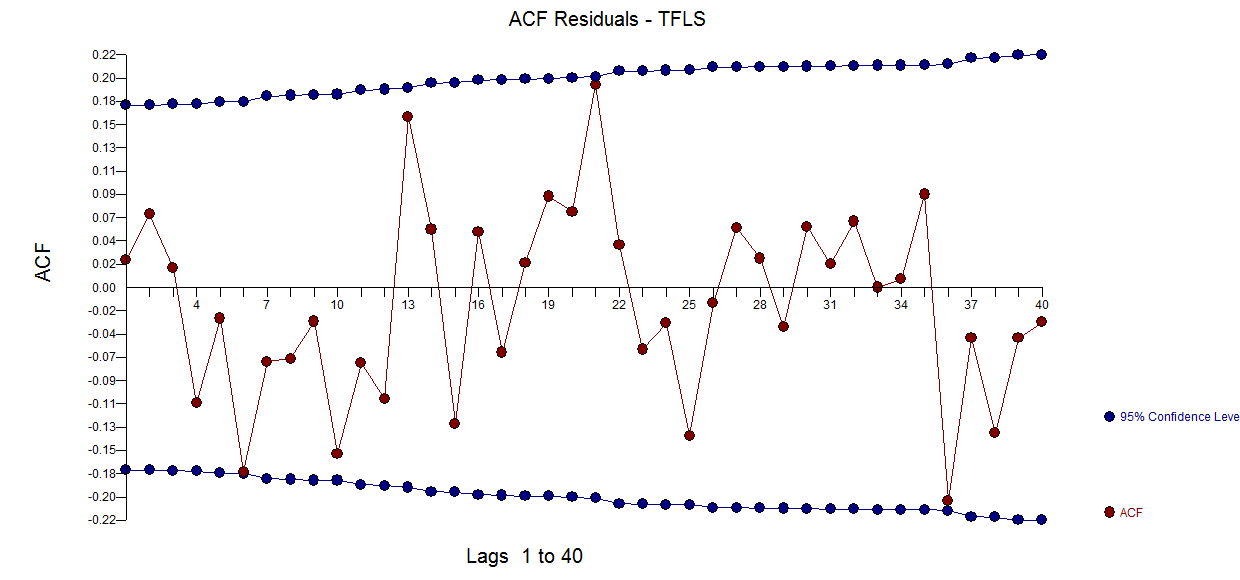
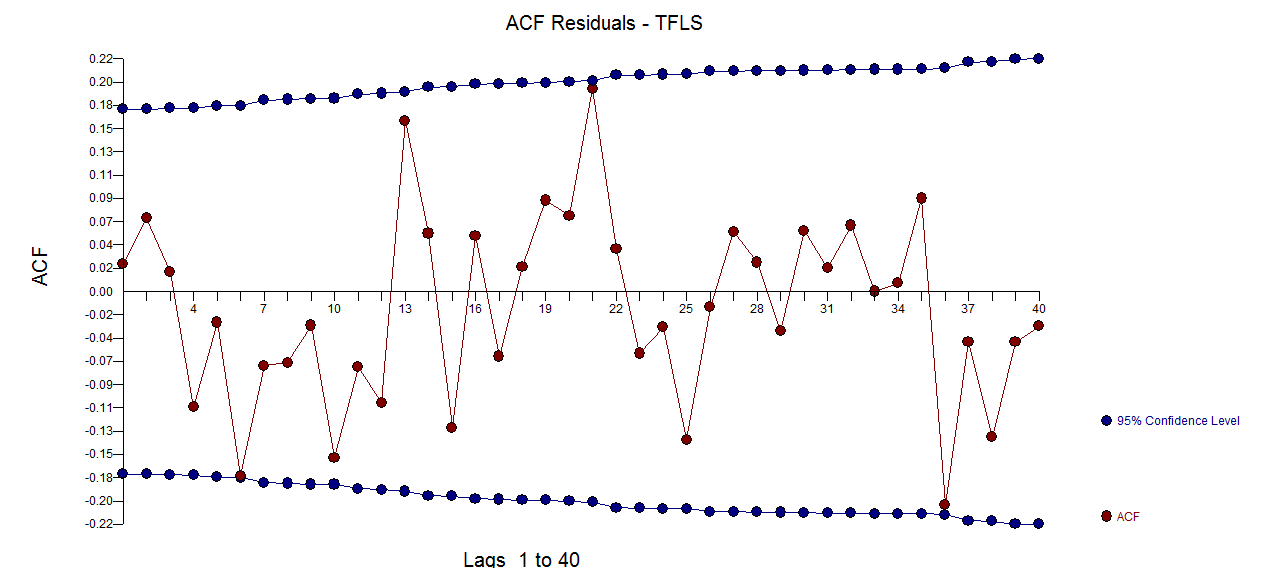
In http://www.autobox.com/stack/yaffe.xlsx we have 134 months of data ( Y first then X) . The OLS solution is here enter image description here with model statistics enter image description here . The acf of the residuals suggest model inadequacy enter image description here. The actual/fit and forecast graph is here enter image description here suggesting clumps of non-zero residuals. The actual plot of these questionable residuals is here enter image description here A comprehensive approach GLS suggests not only suggests the existence/presence of auto-correlative structure but the impact of a level shift, seasonal pulse and some one-time only pulses in addition to a lag/delayed effect of the user-specified predictor variable X. Here is the GLS modelenter image description here and here enter image description here with final model statistics here enter image description here . The plot of the acf of the residuals appears to suggest model sufficiency enter image description here with residual plot enter image description here and a respectable enter image description herelooking actual . fit and forecast graph . Note that a GLS soultion not only deals with off-diagonal effects but possible variance change effects (not seen in this example) AND non-constancy in the expected error term (found in this example by the inclusion of a level shift and a seasonal pulse and a few one-time anomalies. Here is the plot of the acf for the errors from this model enter image description here suggsting sufficiency.
The following not only answers the OP's question about a data set that requires more than a simple OLS solution BUT also answers more general questions (unasked by the OP) regarding other possible deficiencies of OLS When applied to time series data. I use AUTOBOX here ( a piece of software I have helped develop) but one could use any software that can incorporate user-specified predictors while identifying an appropriatw arima structure and the need for any necessary unspecified dummy variables reflecting unspecified deterministic changes in the data.

TIME SERIES DATA

In http://www.autobox.com/stack/yaffe.xlsx we have 134 months of data ( Y first then X) . The OLS solution is here enter image description here with model statistics enter image description here . The acf of the residuals suggest model inadequacy enter image description here. The actual/fit and forecast graph is here enter image description here suggesting clumps of non-zero residuals. The actual plot of these questionable residuals is here enter image description here A comprehensive approach GLS suggests not only suggests the existence/presence of auto-correlative structure but the impact of a level shift, seasonal pulse and some one-time only pulses in addition to a lag/delayed effect of the user-specified predictor variable X. Here is the GLS modelenter image description here and here enter image description here with final model statistics here enter image description here . The plot of the acf of the residuals appears to suggest model sufficiency enter image description here with residual plot enter image description here and a respectable enter image description herelooking actual . fit and forecast graph . Note that a GLS soultion not only deals with off-diagonal effects but possible variance change effects (not seen in this example) AND non-constancy in the expected error term (found in this example by the inclusion of a level shift and a seasonal pulse and a few one-time anomalies. Here is the plot of the acf for the errors from this model enter image description here suggsting sufficiency.

The following not only answers the OP's question about a data set that requires more than a simple OLS solution BUT also answers more general questions (unasked by the OP) regarding other possible deficiencies of OLS When applied to time series data. I use AUTOBOX here ( a piece of software I have helped develop) but one could use any software that can incorporate user-specified predictors while identifying an appropriatw arima structure and the need for any necessary unspecified dummy variables reflecting unspecified deterministic changes in the data. For a simpler problem set (less complicated solution required) just use the first 68 values.

TIME SERIES DATA

In http://www.autobox.com/stack/yaffe.xlsx we have 134 months of data ( Y first then X) . The OLS solution is here enter image description here with model statistics enter image description here . The acf of the residuals suggest model inadequacy enter image description here. The actual/fit and forecast graph is here enter image description here suggesting clumps of non-zero residuals. The actual plot of these questionable residuals is here enter image description here A comprehensive approach GLS suggests not only suggests the existence/presence of auto-correlative structure but the impact of a level shift, seasonal pulse and some one-time only pulses in addition to a lag/delayed effect of the user-specified predictor variable X. Here is the GLS modelenter image description here and here enter image description here with final model statistics here enter image description here . The plot of the acf of the residuals appears to suggest model sufficiency enter image description here with residual plot enter image description here and a respectable enter image description herelooking actual . fit and forecast graph . Note that a GLS soultion not only deals with off-diagonal effects but possible variance change effects (not seen in this example) AND non-constancy in the expected error term (found in this example by the inclusion of a level shift and a seasonal pulse and a few one-time anomalies. Here is the plot of the acf for the errors from this model enter image description here suggsting sufficiency.

added 307 characters in body
Source Link
IrishStat
  • 30k
  • 5
  • 36
  • 60

The following not only answers the OP's question about a data set that requires more than a simple OLS solution BUT also answers more general questions (unasked by the OP) regarding other possible deficiencies of OLS When applied to time series data. I use AUTOBOX here ( a piece of software I have helped develop) but one could use any software that can incorporate user-specified predictors while identifying an appropriatw arima structure and the need for any necessary unspecified dummy variables reflecting unspecified deterministic changes in the data.

TIME SERIES DATA

In http://www.autobox.com/stack/yaffe.xlsx we have 134 months of data ( Y first then X) . The OLS solution is here enter image description here with model statistics enter image description here . The acf of the residuals suggest model inadequacy enter image description here. The actual/fit and forecast graph is here enter image description here suggesting clumps of non-zero residuals. The actual plot of these questionable residuals is here enter image description here A comprehensive approach GLS suggests not only suggests the existence/presence of auto-correlative structure but the impact of a level shift, seasonal pulse and some one-time only pulses in addition to a lag/delayed effect of the user-specified predictor variable X. Here is the GLS modelenter image description here and here enter image description here with final model statistics here enter image description here . The plot of the acf of the residuals appears to suggest model sufficiency enter image description here with residual plot enter image description here and a respectable enter image description herelooking actual . fit and forecast graph . Note that a GLS soultion not only deals with off-diagonal effects but possible variance change effects (not seen in this example) AND non-constancy in the expected error term (found in this example by the inclusion of a level shift and a seasonal pulse and a few one-time anomalies. Here is the plot of the acf for the errors from this model enter image description here suggsting sufficiency.

The following not only answers the OP's question about a data set that requires more than a simple OLS solution BUT also answers more general questions (unasked by the OP) regarding other possible deficiencies of OLS When applied to time series data.

TIME SERIES DATA

In http://www.autobox.com/stack/yaffe.xlsx we have 134 months of data ( Y first then X) . The OLS solution is here enter image description here with model statistics enter image description here . The acf of the residuals suggest model inadequacy enter image description here. The actual/fit and forecast graph is here enter image description here suggesting clumps of non-zero residuals. The actual plot of these questionable residuals is here enter image description here A comprehensive approach GLS suggests not only suggests the existence/presence of auto-correlative structure but the impact of a level shift, seasonal pulse and some one-time only pulses in addition to a lag/delayed effect of the user-specified predictor variable X. Here is the GLS modelenter image description here and here enter image description here with final model statistics here enter image description here . The plot of the acf of the residuals appears to suggest model sufficiency enter image description here with residual plot enter image description here and a respectable enter image description herelooking actual . fit and forecast graph . Note that a GLS soultion not only deals with off-diagonal effects but possible variance change effects (not seen in this example) AND non-constancy in the expected error term (found in this example by the inclusion of a level shift and a seasonal pulse and a few one-time anomalies. Here is the plot of the acf for the errors from this model enter image description here suggsting sufficiency.

The following not only answers the OP's question about a data set that requires more than a simple OLS solution BUT also answers more general questions (unasked by the OP) regarding other possible deficiencies of OLS When applied to time series data. I use AUTOBOX here ( a piece of software I have helped develop) but one could use any software that can incorporate user-specified predictors while identifying an appropriatw arima structure and the need for any necessary unspecified dummy variables reflecting unspecified deterministic changes in the data.

TIME SERIES DATA

In http://www.autobox.com/stack/yaffe.xlsx we have 134 months of data ( Y first then X) . The OLS solution is here enter image description here with model statistics enter image description here . The acf of the residuals suggest model inadequacy enter image description here. The actual/fit and forecast graph is here enter image description here suggesting clumps of non-zero residuals. The actual plot of these questionable residuals is here enter image description here A comprehensive approach GLS suggests not only suggests the existence/presence of auto-correlative structure but the impact of a level shift, seasonal pulse and some one-time only pulses in addition to a lag/delayed effect of the user-specified predictor variable X. Here is the GLS modelenter image description here and here enter image description here with final model statistics here enter image description here . The plot of the acf of the residuals appears to suggest model sufficiency enter image description here with residual plot enter image description here and a respectable enter image description herelooking actual . fit and forecast graph . Note that a GLS soultion not only deals with off-diagonal effects but possible variance change effects (not seen in this example) AND non-constancy in the expected error term (found in this example by the inclusion of a level shift and a seasonal pulse and a few one-time anomalies. Here is the plot of the acf for the errors from this model enter image description here suggsting sufficiency.

added 395 characters in body
Source Link
IrishStat
  • 30k
  • 5
  • 36
  • 60

The following not only answers the OP's question about a data set that requires more than a simple OLS solution BUT also answers more general questions (unasked by the OP) regarding other possible deficiencies of OLS When applied to time series data.

TIME SERIES DATA

In http://www.autobox.com/stack/yaffe.xlsx we have 134 months of data ( Y first then X) . The OLS solution is here enter image description here with model statistics enter image description here . The acf of the residuals suggest model inadequacy enter image description here. The actual/fit and forecast graph is here enter image description here suggesting clumps of non-zero residuals. The actual plot of these questionable residuals is here enter image description here A comprehensive approach GLS suggests not only suggests the existence/presence of auto-correlative structure but the impact of a level shift, seasonal pulse and some one-time only pulses in addition to a lag/delayed effect of the user-specified predictor variable X. Here is the GLS modelenter image description here and here enter image description here with final model statistics here enter image description here . The plot of the acf of the residuals appears to suggest model sufficiency enter image description here with residual plot enter image description here and a respectable enter image description herelooking actual . fit and forecast graph . Note that a GLS soultion not only deals with off-diagonal effects but possible variance change effects (not seen in this example) AND non-constancy in the expected error term (found in this example by the inclusion of a level shift and a seasonal pulse and a few one-time anomalies. Here is the plot of the acf for the errors from this model enter image description here suggsting sufficiency.

In http://www.autobox.com/stack/yaffe.xlsx we have 134 months of data ( Y first then X) . The OLS solution is here enter image description here with model statistics enter image description here . The acf of the residuals suggest model inadequacy enter image description here. The actual/fit and forecast graph is here enter image description here suggesting clumps of non-zero residuals. The actual plot of these questionable residuals is here enter image description here A comprehensive approach GLS suggests not only suggests the existence/presence of auto-correlative structure but the impact of a level shift, seasonal pulse and some one-time only pulses in addition to a lag/delayed effect of the user-specified predictor variable X. Here is the GLS modelenter image description here and here enter image description here with final model statistics here enter image description here . The plot of the acf of the residuals appears to suggest model sufficiency enter image description here with residual plot enter image description here and a respectable enter image description herelooking actual . fit and forecast graph . Note that a GLS soultion not only deals with off-diagonal effects but possible variance change effects (not seen in this example) AND non-constancy in the expected error term (found in this example by the inclusion of a level shift and a seasonal pulse and a few one-time anomalies.

The following not only answers the OP's question about a data set that requires more than a simple OLS solution BUT also answers more general questions (unasked by the OP) regarding other possible deficiencies of OLS When applied to time series data.

TIME SERIES DATA

In http://www.autobox.com/stack/yaffe.xlsx we have 134 months of data ( Y first then X) . The OLS solution is here enter image description here with model statistics enter image description here . The acf of the residuals suggest model inadequacy enter image description here. The actual/fit and forecast graph is here enter image description here suggesting clumps of non-zero residuals. The actual plot of these questionable residuals is here enter image description here A comprehensive approach GLS suggests not only suggests the existence/presence of auto-correlative structure but the impact of a level shift, seasonal pulse and some one-time only pulses in addition to a lag/delayed effect of the user-specified predictor variable X. Here is the GLS modelenter image description here and here enter image description here with final model statistics here enter image description here . The plot of the acf of the residuals appears to suggest model sufficiency enter image description here with residual plot enter image description here and a respectable enter image description herelooking actual . fit and forecast graph . Note that a GLS soultion not only deals with off-diagonal effects but possible variance change effects (not seen in this example) AND non-constancy in the expected error term (found in this example by the inclusion of a level shift and a seasonal pulse and a few one-time anomalies. Here is the plot of the acf for the errors from this model enter image description here suggsting sufficiency.

added 87 characters in body
Source Link
IrishStat
  • 30k
  • 5
  • 36
  • 60
Loading
Source Link
IrishStat
  • 30k
  • 5
  • 36
  • 60
Loading