added 1 character in body
Source Link
Ted
  • 303
  • 2
  • 3
  • 11
added new queries
Source Link
Ted
  • 303
  • 2
  • 3
  • 11
  1. If I am not wrong, tsoutliers package will remove the outliers it detect and through the use of the dataset with outliers removed, it will give us the best arima model suited for the data set, is it correct?
  2. The adjust series data set is being shifted down by a lot due to remove of the level shift,etc. Doesn't this mean that if the forecasting is done on the adjusted series, the output of the forecast will be very inaccurate, since the more recent data are already more than 12, while adjusted data shift it to around 7-8.
  3. What does warning message 4 and 5 means? Does it mean it cannot do auto.arima using the adjusted series?
  4. What does the [12] in ARIMA(0,1,0)(0,0,1)[12] mean? Is it just my frequency/periodicity of my dataset, which I set it to monthly? And does this also means that my data series is seasonal as well?
  5. How do I detect seasonality in my data set? As from the visualisation of the time series plot, I cant see any obvious trend, and if I use the decompose function, it will assume that there is a seasonal trend? So do I just believe what the tsoutliers tell me, where there is seasonal trend, since there is MA of order 1?
  6. How do I continue to do my forecasting with this data after identifying these outliers?
  7. How to incorporate these outliers to other forecasting models - Exponential Smoothing, ARIMA, Strutural Model, Random Walk, theta? I am sure I cannot remove the outliers since there are level shift, and if I only take adjusted series data, the values will be too small, so what do I do?

Do I need to add these outliers as regressor in the auto.arima for forecasting? How does this work then?

  1. If I am not wrong, tsoutliers package will remove the outliers it detect and through the use of the dataset with outliers removed, it will give us the best arima model suited for the data set, is it correct?
  2. The adjust series data set is being shifted down by a lot due to remove of the level shift,etc. Doesn't this mean that if the forecasting is done on the adjusted series, the output of the forecast will be very inaccurate, since the more recent data are already more than 12, while adjusted data shift it to around 7-8.
  3. What does warning message 4 and 5 means? Does it mean it cannot do auto.arima using the adjusted series?
  4. What does the [12] in ARIMA(0,1,0)(0,0,1)[12] mean? Is it just my frequency/periodicity of my dataset, which I set it to monthly? And does this also means that my data series is seasonal as well?
  5. How do I detect seasonality in my data set? As from the visualisation of the time series plot, I cant see any obvious trend, and if I use the decompose function, it will assume that there is a seasonal trend? So do I just believe what the tsoutliers tell me, where there is seasonal trend, since there is MA of order 1?
  6. How do I continue to do my forecasting with this data after identifying these outliers?
  7. How to incorporate these outliers to other forecasting models - Exponential Smoothing, ARIMA, Strutural Model, Random Walk, theta? I am sure I cannot remove the outliers since there are level shift, and if I only take adjusted series data, the values will be too small, so what do I do?

Do I need to add these outliers as regressor in the auto.arima for forecasting? How does this work then?

Tweeted twitter.com/#!/StackStats/status/636993274469740545
Source Link
Ted
  • 303
  • 2
  • 3
  • 11

How to interpret and do forecasting using tsoutliers package and auto.arima

I have got monthly data from 1993 to 2015 and would like to do forecasting on these data. I used tsoutliers package to detect the outliers, but I do not know how do I continue to forecast with my set of data.

This is my code:

product.outlier<-tso(product,types=c("AO","LS","TC"))
plot(product.outlier)

This is my output from tsoutliers package

ARIMA(0,1,0)(0,0,1)[12]                    

Coefficients:
        sma1    LS46    LS51    LS61    TC133   LS181   AO183   AO184   LS185   TC186    TC193    TC200
      0.1700  0.4316  0.6166  0.5793  -0.5127  0.5422  0.5138  0.9264  3.0762  0.5688  -0.4775  -0.4386
s.e.  0.0768  0.1109  0.1105  0.1106   0.1021  0.1120  0.1119  0.1567  0.1918  0.1037   0.1033   0.1040
       LS207    AO237    TC248    AO260    AO266
      0.4228  -0.3815  -0.4082  -0.4830  -0.5183
s.e.  0.1129   0.0782   0.1030   0.0801   0.0805

sigma^2 estimated as 0.01258:  log likelihood=205.91
AIC=-375.83   AICc=-373.08   BIC=-311.19

 Outliers:
    type ind    time coefhat  tstat
1    LS  46 1996:10  0.4316  3.891
2    LS  51 1997:03  0.6166  5.579
3    LS  61 1998:01  0.5793  5.236
4    TC 133 2004:01 -0.5127 -5.019
5    LS 181 2008:01  0.5422  4.841 
6    AO 183 2008:03  0.5138  4.592
7    AO 184 2008:04  0.9264  5.911
8    LS 185 2008:05  3.0762 16.038
9    TC 186 2008:06  0.5688  5.483
10   TC 193 2009:01 -0.4775 -4.624
11   TC 200 2009:08 -0.4386 -4.217
12   LS 207 2010:03  0.4228  3.746
13   AO 237 2012:09 -0.3815 -4.877
14   TC 248 2013:08 -0.4082 -3.965
15   AO 260 2014:08 -0.4830 -6.027
16   AO 266 2015:02 -0.5183 -6.442
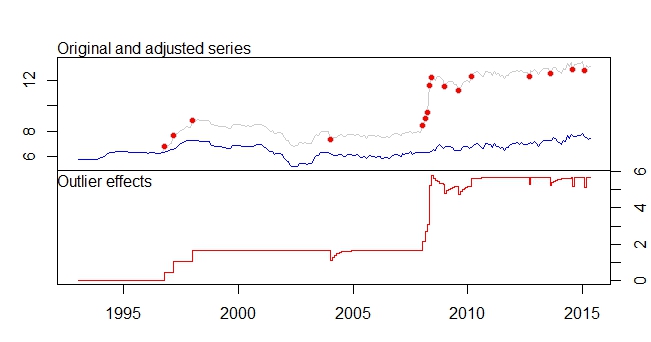
This is my plot

I have these warning messages as well.

Warning messages:
1: In locate.outliers.iloop(resid = resid, pars = pars, cval = cval,  :
  stopped when ‘maxit’ was reached
2: In locate.outliers.iloop(resid = resid, pars = pars, cval = cval,  :
  stopped when ‘maxit’ was reached
3: In locate.outliers.oloop(y = y, fit = fit, types = types, cval = cval,  :
  stopped when ‘maxit’ was reached
4: In arima(x, order = c(1, d, 0), xreg = xreg) :
  possible convergence problem: optim gave code = 1
5: In auto.arima(x = c(5.77, 5.79, 5.79, 5.79, 5.79, 5.79, 5.78, 5.78,  :
  Unable to fit final model using maximum likelihood. AIC value approximated

Doubts:

  1. If I am not wrong, tsoutliers package will remove the outliers it detect and through the use of the dataset with outliers removed, it will give us the best arima model suited for the data set, is it correct?
  2. The adjust series data set is being shifted down by a lot due to remove of the level shift,etc. Doesn't this mean that if the forecasting is done on the adjusted series, the output of the forecast will be very inaccurate, since the more recent data are already more than 12, while adjusted data shift it to around 7-8.
  3. What does warning message 4 and 5 means? Does it mean it cannot do auto.arima using the adjusted series?
  4. What does the [12] in ARIMA(0,1,0)(0,0,1)[12] mean? Is it just my frequency/periodicity of my dataset, which I set it to monthly? And does this also means that my data series is seasonal as well?
  5. How do I detect seasonality in my data set? As from the visualisation of the time series plot, I cant see any obvious trend, and if I use the decompose function, it will assume that there is a seasonal trend? So do I just believe what the tsoutliers tell me, where there is seasonal trend, since there is MA of order 1?
  6. How do I continue to do my forecasting with this data after identifying these outliers?