Tweeted twitter.com/StackStats/status/661059844041015296

enter image description here

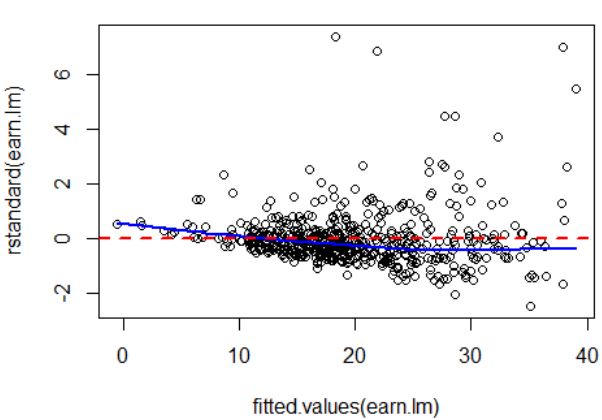
Based on only the above plot, what comments would you make about whether the OLS assumptions are satisfied (in? In particular homoskedasticity, normality)?

I. I just want to know if I'm right. It seems to me that:

-There seems to be some heteroskedasticity present, since the variance seems to increase with higher fitted values.

-There are quite a few large outliers (e.g. those around the fitted value 20), so the kurtosis might be higher than that of a normal distribution

-Overall the violation of these assumptions does not seem to be extreme

  • There seems to be some heteroskedasticity present, since the variance seems to increase with higher fitted values.
  • There are quite a few large outliers, e.g. those around fitted value 20. So the kurtosis might be higher than that of a normal distribution
  • Overall the violation of these assumptions does not seem to be extreme.

Is that correct? And And are there any other specific observations that can be made which I missed?

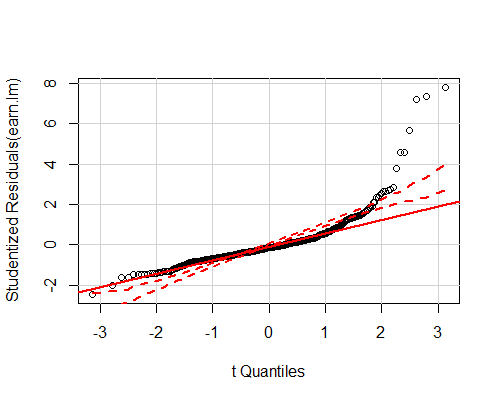
Finally, is it correct that the below plot confirms that there is indeed heteroskedasticity, or what do you make of it?

enter image description here

enter image description here

Based on only the above plot, what comments would you make about whether the OLS assumptions are satisfied (in particular homoskedasticity, normality)?

I just want to know if I'm right. It seems to me that:

-There seems to be some heteroskedasticity present, since the variance seems to increase with higher fitted values.

-There are quite a few large outliers (e.g. those around the fitted value 20), so the kurtosis might be higher than that of a normal distribution

-Overall the violation of these assumptions does not seem to be extreme

Is that correct? And are there any other specific observations that can be made which I missed?

Finally, is it correct that the below plot confirms that there is indeed heteroskedasticity, or what do you make of it?
enter image description here

enter image description here

Based on only the above plot, what comments would you make about whether the OLS assumptions are satisfied? In particular homoskedasticity, normality. I just want to know if I'm right. It seems to me that:

  • There seems to be some heteroskedasticity present, since the variance seems to increase with higher fitted values.
  • There are quite a few large outliers, e.g. those around fitted value 20. So the kurtosis might be higher than that of a normal distribution
  • Overall the violation of these assumptions does not seem to be extreme.

Is that correct? And are there any other specific observations that can be made which I missed?

Finally, is it correct that the below plot confirms that there is indeed heteroskedasticity, or what do you make of it?

enter image description here

added 208 characters in body
Source Link
rbm
  • 1k
  • 3
  • 15
  • 37

enter image description here

Based on only the above plot, what comments would you make about whether the OLS assumptions are satisfied (in particular homoskedasticity, normality)?

I just want to know if I'm right. It seems to me that:

-There seems to be some heteroskedasticity present, since the variance seems to increase with higher fitted values.

-There are quite a few large outliers (e.g. those around the fitted value 20), so the kurtosis might be higher than that of a normal distribution

-Overall the violation of these assumptions does not seem to be extreme

Is that correct? And are there any other specific observations that can be made which I missed?

Finally, is it correct that the below plot confirms that there is indeed heteroskedasticity, or what do you make of it?

enter image description here

enter image description here

Based on the above plot, what comments would you make about whether the OLS assumptions are satisfied (in particular homoskedasticity, normality)?

I just want to know if I'm right. It seems to me that:

-There seems to be some heteroskedasticity present, since the variance seems to increase with higher fitted values.

-There are quite a few large outliers (e.g. those around the fitted value 20), so the kurtosis might be higher than that of a normal distribution

-Overall the violation of these assumptions does not seem to be extreme

Is that correct? And are there any other specific observations that can be made which I missed?

enter image description here

Based on only the above plot, what comments would you make about whether the OLS assumptions are satisfied (in particular homoskedasticity, normality)?

I just want to know if I'm right. It seems to me that:

-There seems to be some heteroskedasticity present, since the variance seems to increase with higher fitted values.

-There are quite a few large outliers (e.g. those around the fitted value 20), so the kurtosis might be higher than that of a normal distribution

-Overall the violation of these assumptions does not seem to be extreme

Is that correct? And are there any other specific observations that can be made which I missed?

Finally, is it correct that the below plot confirms that there is indeed heteroskedasticity, or what do you make of it?

enter image description here

Source Link
rbm
  • 1k
  • 3
  • 15
  • 37

Standardized residuals vs fitted values: OLS assumptions satisfied?

enter image description here

Based on the above plot, what comments would you make about whether the OLS assumptions are satisfied (in particular homoskedasticity, normality)?

I just want to know if I'm right. It seems to me that:

-There seems to be some heteroskedasticity present, since the variance seems to increase with higher fitted values.

-There are quite a few large outliers (e.g. those around the fitted value 20), so the kurtosis might be higher than that of a normal distribution

-Overall the violation of these assumptions does not seem to be extreme

Is that correct? And are there any other specific observations that can be made which I missed?