Tweeted twitter.com/StackStats/status/676919497954078726
added a snippet of the paper to describe the minimum sample size calculation
Source Link
statsNoob
  • 401
  • 2
  • 14

I am interested in using the results from this paper (Modified exact sample size for a binomial proportion with special emphasis on diagnostic rest parameter estimation by Geoffrey Fosgate) to calculate sample sizes. There is an implementation of the algorithm used to calculate the sample size in R's binomSamSize package. I have checked the code used to calculate this and it seems to follow the paper exactly, but the results shown in the paper's results section do not seem to be reproducible. The sample sizes turn out to be too small.

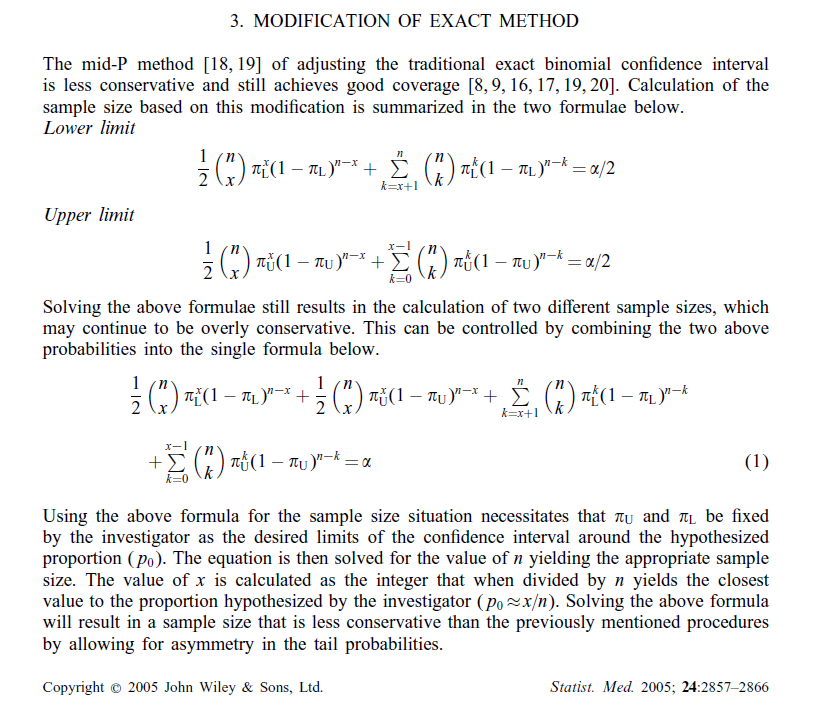
HereThe paper requires a subscription to be viewed in it's entirety, but here is a snippet to show how the sample size is calculated:

enter image description here

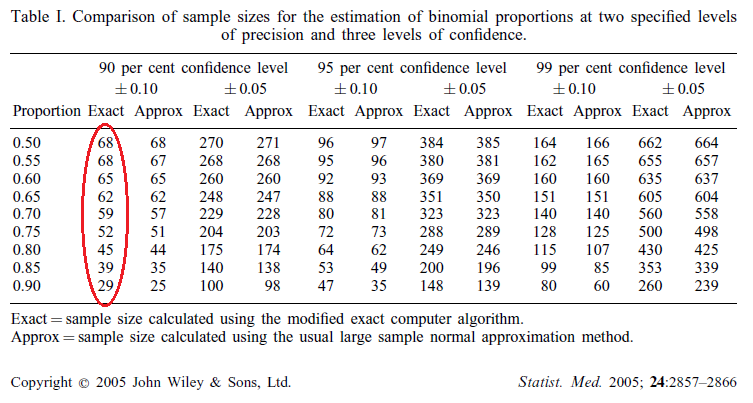
Here are the results I want to reproduce: enter image description here
Here is the code I am using (lifted from the binomSamSize package):

ciss.midp <- function(p0, d, alpha, nMax = 1e+06){
  pi.L <- p0 - d
  pi.U <- p0 + d
  if (pi.L < 0) 
    stop("p0 - d is below zero!")
  if (pi.U > 1) 
    stop("p0 + d is above one!")
  n <- floor(max(1/p0, 1/(1 - p0)))
  done <- FALSE
  while (!done & (n < nMax)) {
    n <- n + 1
    x <- round(p0 * n)
    lhs2 <- 1/2 * dbinom(x, size = n, prob = pi.L) + 1/2 * 
      dbinom(x, size = n, prob = pi.U) + 
      pbinom(x, size = n, prob = pi.L, lower.tail = FALSE) + 
      pbinom(x - 1, size = n, prob = pi.U)
    if (!is.na(lhs2)) {
      done <- (lhs2 < alpha)
    }
  }
  return(n)
}

What I end up getting to produce the circled column is this:

> sapply(seq(0.5, 0.9, 0.05), function(i) ciss.midp(p0=i, d=0.1, alpha=0.1))
[1] 68 67 65 61 57 50 42 34 23

PS: My linkIf there is anything else I can provide to the paper involves a subscriptionmake this easier to answer, does anyoneplease let me know if I am allowed to post a snippet of the paper orin the paper itself?comments.

I am interested in using the results from this paper (Modified exact sample size for a binomial proportion with special emphasis on diagnostic rest parameter estimation by Geoffrey Fosgate) to calculate sample sizes. There is an implementation of the algorithm used to calculate the sample size in R's binomSamSize package. I have checked the code used to calculate this and it seems to follow the paper exactly, but the results shown in the paper's results section do not seem to be reproducible. The sample sizes turn out to be too small.

Here is the results I want to reproduce: enter image description here

Here is the code I am using (lifted from the binomSamSize package):

ciss.midp <- function(p0, d, alpha, nMax = 1e+06){
  pi.L <- p0 - d
  pi.U <- p0 + d
  if (pi.L < 0) 
    stop("p0 - d is below zero!")
  if (pi.U > 1) 
    stop("p0 + d is above one!")
  n <- floor(max(1/p0, 1/(1 - p0)))
  done <- FALSE
  while (!done & (n < nMax)) {
    n <- n + 1
    x <- round(p0 * n)
    lhs2 <- 1/2 * dbinom(x, size = n, prob = pi.L) + 1/2 * 
      dbinom(x, size = n, prob = pi.U) + 
      pbinom(x, size = n, prob = pi.L, lower.tail = FALSE) + 
      pbinom(x - 1, size = n, prob = pi.U)
    if (!is.na(lhs2)) {
      done <- (lhs2 < alpha)
    }
  }
  return(n)
}

What I end up getting to produce the circled column is this:

> sapply(seq(0.5, 0.9, 0.05), function(i) ciss.midp(p0=i, d=0.1, alpha=0.1))
[1] 68 67 65 61 57 50 42 34 23

PS: My link to the paper involves a subscription, does anyone know if I am allowed to post a snippet of the paper or the paper itself?

I am interested in using the results from this paper (Modified exact sample size for a binomial proportion with special emphasis on diagnostic rest parameter estimation by Geoffrey Fosgate) to calculate sample sizes. There is an implementation of the algorithm used to calculate the sample size in R's binomSamSize package. I have checked the code used to calculate this and it seems to follow the paper exactly, but the results shown in the paper's results section do not seem to be reproducible. The sample sizes turn out to be too small.

The paper requires a subscription to be viewed in it's entirety, but here is a snippet to show how the sample size is calculated:

enter image description here

Here are the results I want to reproduce: enter image description here

Here is the code I am using (lifted from the binomSamSize package):

ciss.midp <- function(p0, d, alpha, nMax = 1e+06){
  pi.L <- p0 - d
  pi.U <- p0 + d
  if (pi.L < 0) 
    stop("p0 - d is below zero!")
  if (pi.U > 1) 
    stop("p0 + d is above one!")
  n <- floor(max(1/p0, 1/(1 - p0)))
  done <- FALSE
  while (!done & (n < nMax)) {
    n <- n + 1
    x <- round(p0 * n)
    lhs2 <- 1/2 * dbinom(x, size = n, prob = pi.L) + 1/2 * 
      dbinom(x, size = n, prob = pi.U) + 
      pbinom(x, size = n, prob = pi.L, lower.tail = FALSE) + 
      pbinom(x - 1, size = n, prob = pi.U)
    if (!is.na(lhs2)) {
      done <- (lhs2 < alpha)
    }
  }
  return(n)
}

What I end up getting to produce the circled column is this:

> sapply(seq(0.5, 0.9, 0.05), function(i) ciss.midp(p0=i, d=0.1, alpha=0.1))
[1] 68 67 65 61 57 50 42 34 23

PS: If there is anything else I can provide to make this easier to answer, please let me know in the comments.

Source Link
statsNoob
  • 401
  • 2
  • 14

Unable to reproduce paper results (sample size)

I am interested in using the results from this paper (Modified exact sample size for a binomial proportion with special emphasis on diagnostic rest parameter estimation by Geoffrey Fosgate) to calculate sample sizes. There is an implementation of the algorithm used to calculate the sample size in R's binomSamSize package. I have checked the code used to calculate this and it seems to follow the paper exactly, but the results shown in the paper's results section do not seem to be reproducible. The sample sizes turn out to be too small.

Here is the results I want to reproduce: enter image description here

Here is the code I am using (lifted from the binomSamSize package):

ciss.midp <- function(p0, d, alpha, nMax = 1e+06){
  pi.L <- p0 - d
  pi.U <- p0 + d
  if (pi.L < 0) 
    stop("p0 - d is below zero!")
  if (pi.U > 1) 
    stop("p0 + d is above one!")
  n <- floor(max(1/p0, 1/(1 - p0)))
  done <- FALSE
  while (!done & (n < nMax)) {
    n <- n + 1
    x <- round(p0 * n)
    lhs2 <- 1/2 * dbinom(x, size = n, prob = pi.L) + 1/2 * 
      dbinom(x, size = n, prob = pi.U) + 
      pbinom(x, size = n, prob = pi.L, lower.tail = FALSE) + 
      pbinom(x - 1, size = n, prob = pi.U)
    if (!is.na(lhs2)) {
      done <- (lhs2 < alpha)
    }
  }
  return(n)
}

What I end up getting to produce the circled column is this:

> sapply(seq(0.5, 0.9, 0.05), function(i) ciss.midp(p0=i, d=0.1, alpha=0.1))
[1] 68 67 65 61 57 50 42 34 23

PS: My link to the paper involves a subscription, does anyone know if I am allowed to post a snippet of the paper or the paper itself?