Post Locked by kjetil b halvorsen
Notice added Historical significance by kjetil b halvorsen
added 60 characters in body
Source Link
kjetil b halvorsen
  • 82.8k
  • 32
  • 201
  • 663

Using R, I'd like to plot two boxplots without the boxes—just the points.

Creating clean boxplots in R is trivial:

business <- runif(50, min = 65, max = 100)
law <- runif(50, min = 60, max = 95)

boxplot(business, law, horizontal=TRUE, names=c("Business", "Law"), col=c('green', 'red'), main="Salary example (boxplot)")
    business <- runif(50, min = 65, max = 100)
    law <- runif(50, min = 60, max = 95)

    boxplot(business, law, horizontal=TRUE, names=
      c("Business", "Law"), col=c('green', 'red'), 
      main="Salary example (boxplot)")
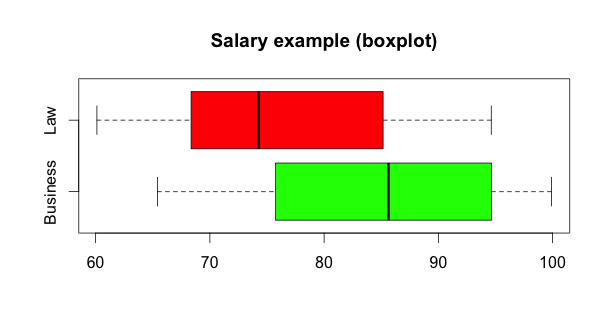
Regular boxplots

However, the only way I've found to plot just the points in the two random distributions seems needlessly complicated: I overlay two scatterplots with each variable plotted against either 1 or 2, to make a flat line:

plot(business, rep(1, length(business)), xlim=range(business, law), ylim=c(0, 3), pch=20, col='green', main="Salary example (dots)")
points(law, rep(2, length(law)), col='red', pch=20)
    plot(business, rep(1, length(business)), 
          xlim=range(business, law), ylim=c(0, 3), pch=20, 
          col='green', main="Salary example (dots)")
    points(law, rep(2, length(law)), col='red', pch=20)

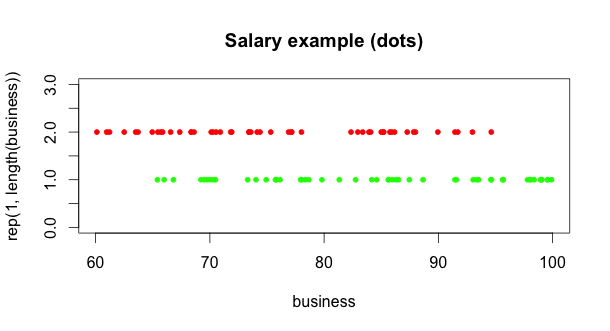
Sample dotted boxplot

While this works, it will require a ton more tweaking to get the axes, tickmarks, and labels to match what R does with boxplot(). It seems that there has to be a simpler, more R-like way to do this. What's the best way to draw a boxplot without the box and whiskers—just the individual points?

Using R, I'd like to plot two boxplots without the boxes—just the points.

Creating clean boxplots in R is trivial:

business <- runif(50, min = 65, max = 100)
law <- runif(50, min = 60, max = 95)

boxplot(business, law, horizontal=TRUE, names=c("Business", "Law"), col=c('green', 'red'), main="Salary example (boxplot)")

Regular boxplots

However, the only way I've found to plot just the points in the two random distributions seems needlessly complicated: I overlay two scatterplots with each variable plotted against either 1 or 2, to make a flat line:

plot(business, rep(1, length(business)), xlim=range(business, law), ylim=c(0, 3), pch=20, col='green', main="Salary example (dots)")
points(law, rep(2, length(law)), col='red', pch=20)

Sample dotted boxplot

While this works, it will require a ton more tweaking to get the axes, tickmarks, and labels to match what R does with boxplot(). It seems that there has to be a simpler, more R-like way to do this. What's the best way to draw a boxplot without the box and whiskers—just the individual points?

Using R, I'd like to plot two boxplots without the boxes—just the points.

Creating clean boxplots in R is trivial:

    business <- runif(50, min = 65, max = 100)
    law <- runif(50, min = 60, max = 95)

    boxplot(business, law, horizontal=TRUE, names=
      c("Business", "Law"), col=c('green', 'red'), 
      main="Salary example (boxplot)")

Regular boxplots

However, the only way I've found to plot just the points in the two random distributions seems needlessly complicated: I overlay two scatterplots with each variable plotted against either 1 or 2, to make a flat line:

    plot(business, rep(1, length(business)), 
          xlim=range(business, law), ylim=c(0, 3), pch=20, 
          col='green', main="Salary example (dots)")
    points(law, rep(2, length(law)), col='red', pch=20)

Sample dotted boxplot

While this works, it will require a ton more tweaking to get the axes, tickmarks, and labels to match what R does with boxplot(). It seems that there has to be a simpler, more R-like way to do this. What's the best way to draw a boxplot without the box and whiskers—just the individual points?

Tweeted twitter.com/#!/StackStats/status/160232134253092864
edited tags
Link
gung - Reinstate Monica
  • 147.5k
  • 89
  • 406
  • 717
Source Link
Andrew
  • 591
  • 4
  • 9
  • 19

How can I draw a boxplot without boxes in R?

Using R, I'd like to plot two boxplots without the boxes—just the points.

Creating clean boxplots in R is trivial:

business <- runif(50, min = 65, max = 100)
law <- runif(50, min = 60, max = 95)

boxplot(business, law, horizontal=TRUE, names=c("Business", "Law"), col=c('green', 'red'), main="Salary example (boxplot)")

Regular boxplots

However, the only way I've found to plot just the points in the two random distributions seems needlessly complicated: I overlay two scatterplots with each variable plotted against either 1 or 2, to make a flat line:

plot(business, rep(1, length(business)), xlim=range(business, law), ylim=c(0, 3), pch=20, col='green', main="Salary example (dots)")
points(law, rep(2, length(law)), col='red', pch=20)

Sample dotted boxplot

While this works, it will require a ton more tweaking to get the axes, tickmarks, and labels to match what R does with boxplot(). It seems that there has to be a simpler, more R-like way to do this. What's the best way to draw a boxplot without the box and whiskers—just the individual points?